MATIC price needs to crack this barrier as Polygon bulls continue targeting $3
- MATIC price rebounds from the critical 61.8% Fibo level.
- Polygon needs a sustained move above the 78.6% Fibo hurdle.
- The uptick in RSI above 50.00 remains in favor of MATIC buyers.

MATIC price is looking to resume its bullish momentum on Sunday, pausing its two-day corrective declines from five-month highs of $2.31.
The token’s rally in the October series could be associated with Polygon’s announcement that it received its first Insurer - Tidal Finance. “The project aims to solve DeFi insurer’s supply and demand problem by “allowing capital leverage as well as additional token incentives to increase capital return,” FXStreet’s Crypto Editor, Akash Girimath, explains.
Over the past week, MATIC price surged as much as 25%, booking a third weekly advance. At the time of writing, the no. 19 coin is adding 5% on the day, trading around $1.95.
MATIC price readies for a fresh upswing amid resurgent demand
From a short-term technical perspective, the upside remains more compelling for MATIC price, especially after the bulls managed to defend $1.846 support, which is the 61.8% Fibonacci Retracement (Fibo) level of the rally from October 12 lows of $1.096 to October 29 highs of $2.31.
The renewed uptick in the 14-day Relative Strength Index (RSI) also backs the rebound in MATIC price this Sunday.
Polygon bulls now need acceptance above the 78.6% Fibo resistance at $2.05 to retest the five-month tops.
Buyers will create fresh positions above the latter, calling for a sharp upswing towards the 127.2% Fibo level at $2.64. More gains could see a test of the $3 round number.
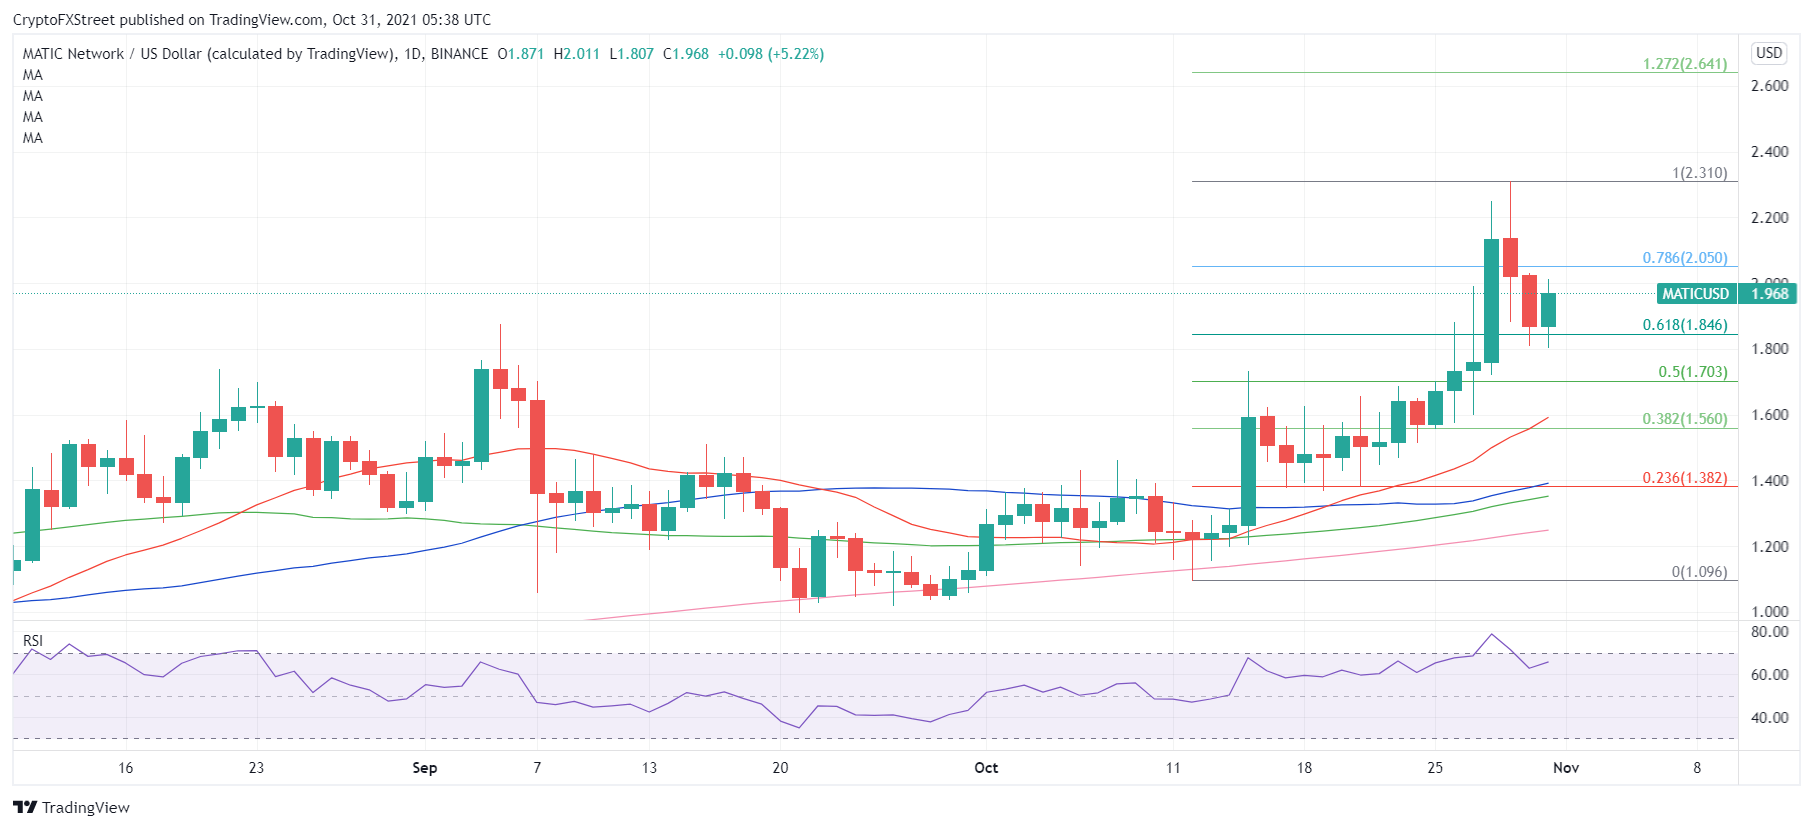
MATIC/USD: Daily chart
On the downside, daily closing above the 61.8% Fibo support is critical to extending the correction towards the $1.70 area, which is the confluence of the 50% Fibo level and October 28 low.
The next fierce support is envisioned around $1.59-$1.56, where the October 27 low, bullish 21-Daily Moving Average (DMA) and 38.2% Fibo level converge.
Author

Dhwani Mehta
FXStreet
Residing in Mumbai (India), Dhwani is a Senior Analyst and Manager of the Asian session at FXStreet. She has over 10 years of experience in analyzing and covering the global financial markets, with specialization in Forex and commodities markets.



