MATIC price could double your gains with 2Ps: Patience and Pullback
- MATIC price has slipped below the 30-, 50-, and 100-day EMAs, denoting a short-term shift in the daily trend.
- A pullback to $0.647 or $0.598 seems likely before an explosive rally to $1.048 and $1.328.
- If Polygon produces a lower low below the July 13 swing low at $0.519, it will invalidate the bullish thesis.

MATIC price has been on a retracement trail for roughly a week and shows signs that this trend will continue. Patient investors will get a perfect opportunity to long Polygon after a retest of a stable support level.
MATIC price needs to shed weight before explosive flight
MATIC price dropped roughly 28% between August 14 and August 20 after rallying nearly 234% in less than two months. This impressive run-up seems to be searching for a stable support level to bounce.
Interestingly the daily trend seems to have shifted in favor of bears after MATIC price sliced through the 30-day, 50-day and 100-day Exponential Moving Averages (EMAs). The most recent attempt to move beyond this level has failed, leading to a retracement.
As a result, investors can expect MATIC price to sweep the equal lows formed at $0.761. A quick recovery above the aforementioned level after a liquidity run is indicative of buying pressure, which will be the first signal market participants should buy.
However, a flip of this barrier could result in a 15% drop to $0.647 and the subsequent support level at $0.598. This area is a perfect buying opportunity for the next leg that will most likely push through the hurdles discussed above and make a run for the $1.04 and $1.32 resistance barriers.
Such a move would constitute a 70% to 120% in gains and is likely where the short-term local top could form.
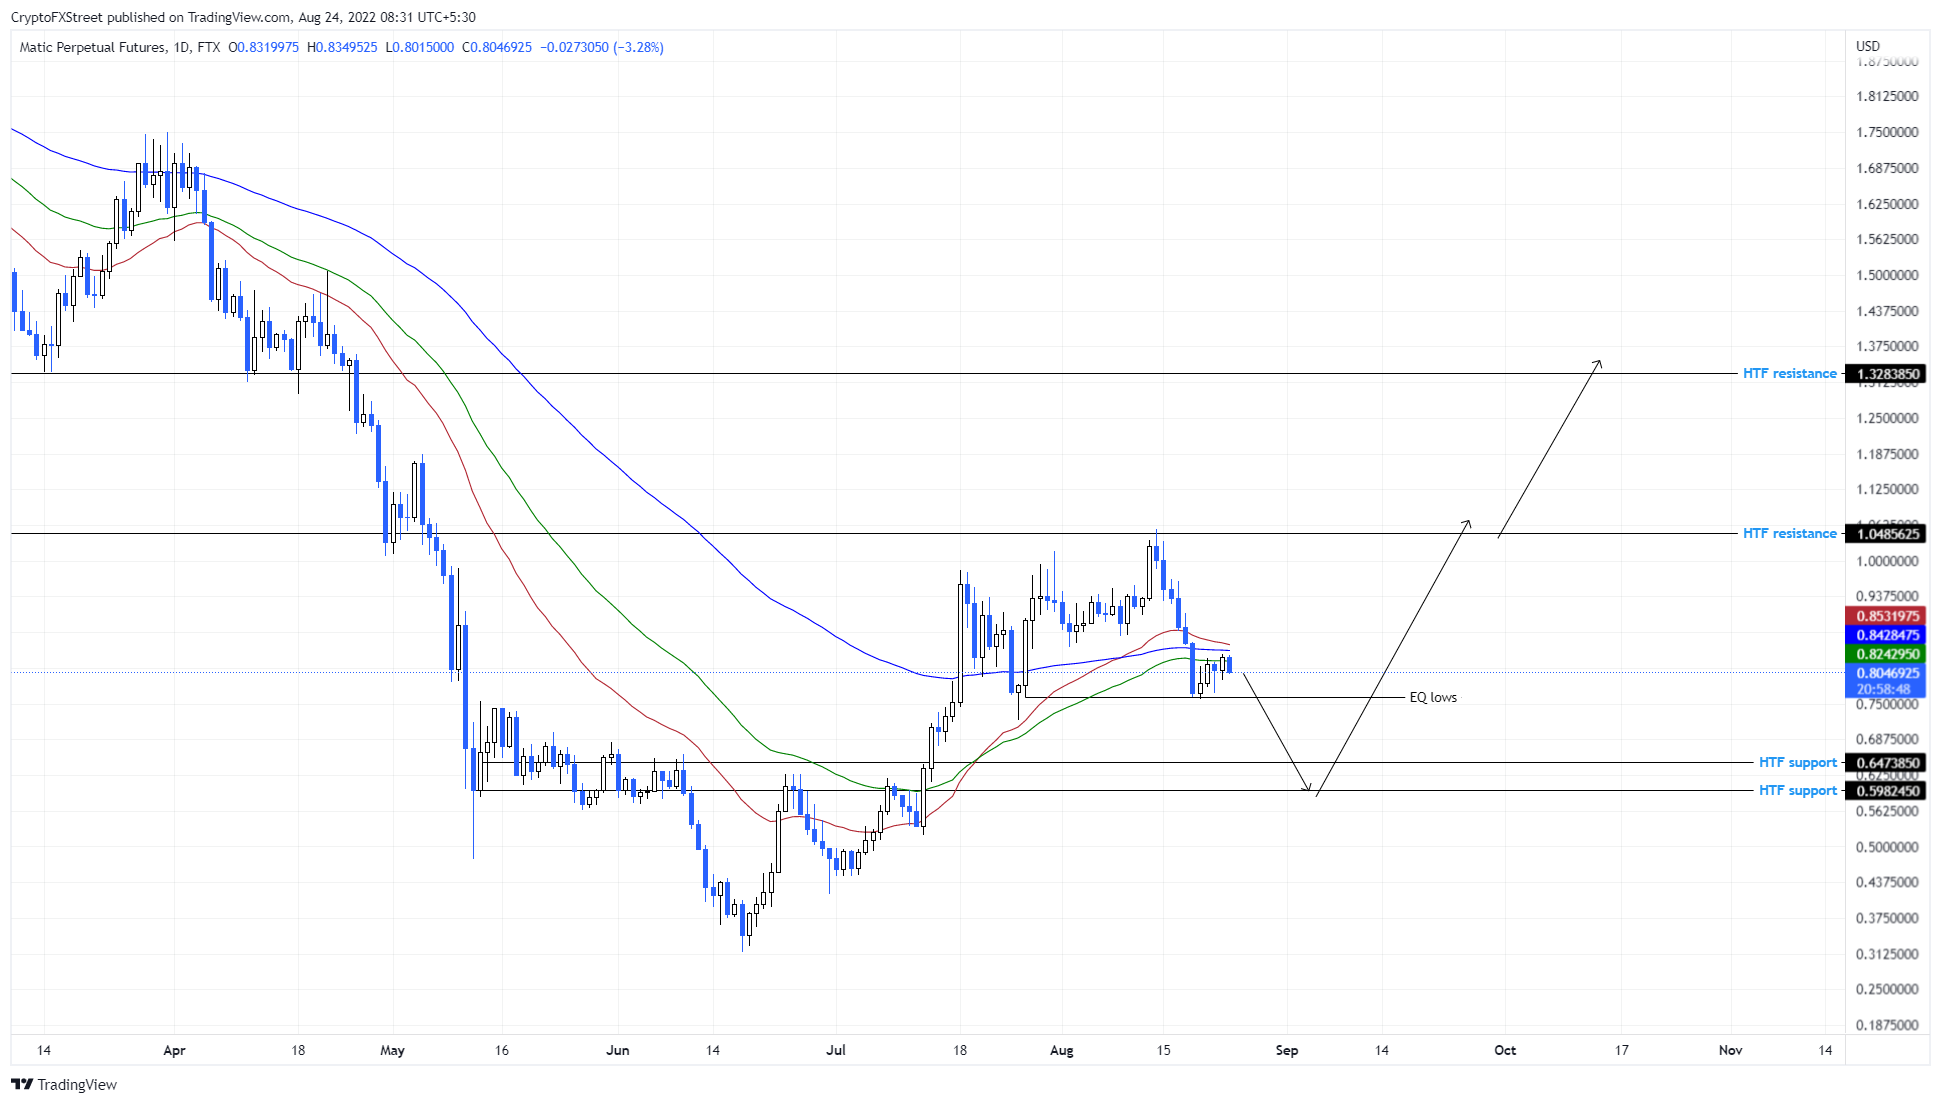
MATIC/USDT 1-day chart
While things are looking up for MATIC price in the longer term, investors need to stomach the potential pullback to $0.647 or $0.598. However, if the sellers are persistent and produce a lower low below the July 13 swing low at $0.519, it will invalidate the bullish thesis. In such a case, MATIC price could revisit the $0.478 support level.
Author

Akash Girimath
FXStreet
Akash Girimath is a Mechanical Engineer interested in the chaos of the financial markets. Trying to make sense of this convoluted yet fascinating space, he switched his engineering job to become a crypto reporter and analyst.