Making a case for 40% rally in Polkadot price as DOT development activity hits an all-time
- Polkadot price looks bullish from both short-term and long-term outlooks.
- An 11% upswing to $6.89 seems more than likely on the lower timeframe.
- Invalidation of the bullish outlook for DOT will occur on the breakdown of the $5.75 support level.

Polkadot (DOT) price shows a clean double bottom formation on the daily timeframe, which predicts a potential bullish reversal. If this outlook is followed by a spike in buying pressure, a quick upswing is likely for DOT.
Read more: Ethereum Shanghai Upgrade is nearing; what to expect from ETH and LSD tokens
Polkadot price reveals positive outlooks for DOT holders
Polkadot price on the daily chart shows that the $6.36 to $8.78 range formed in mid-June 2022 is crucial. A close observation reveals that this range has clearly defined breakouts in the past. From a long-term perspective for DOT, investors could expect a retest of the range’s midpoint at $7.57.
A decisive flip of this hurdle on the daily timeframe could open the path for Polkadot price to tag the range high at $8.78. This move, in total, would constitute a 38% upswing.
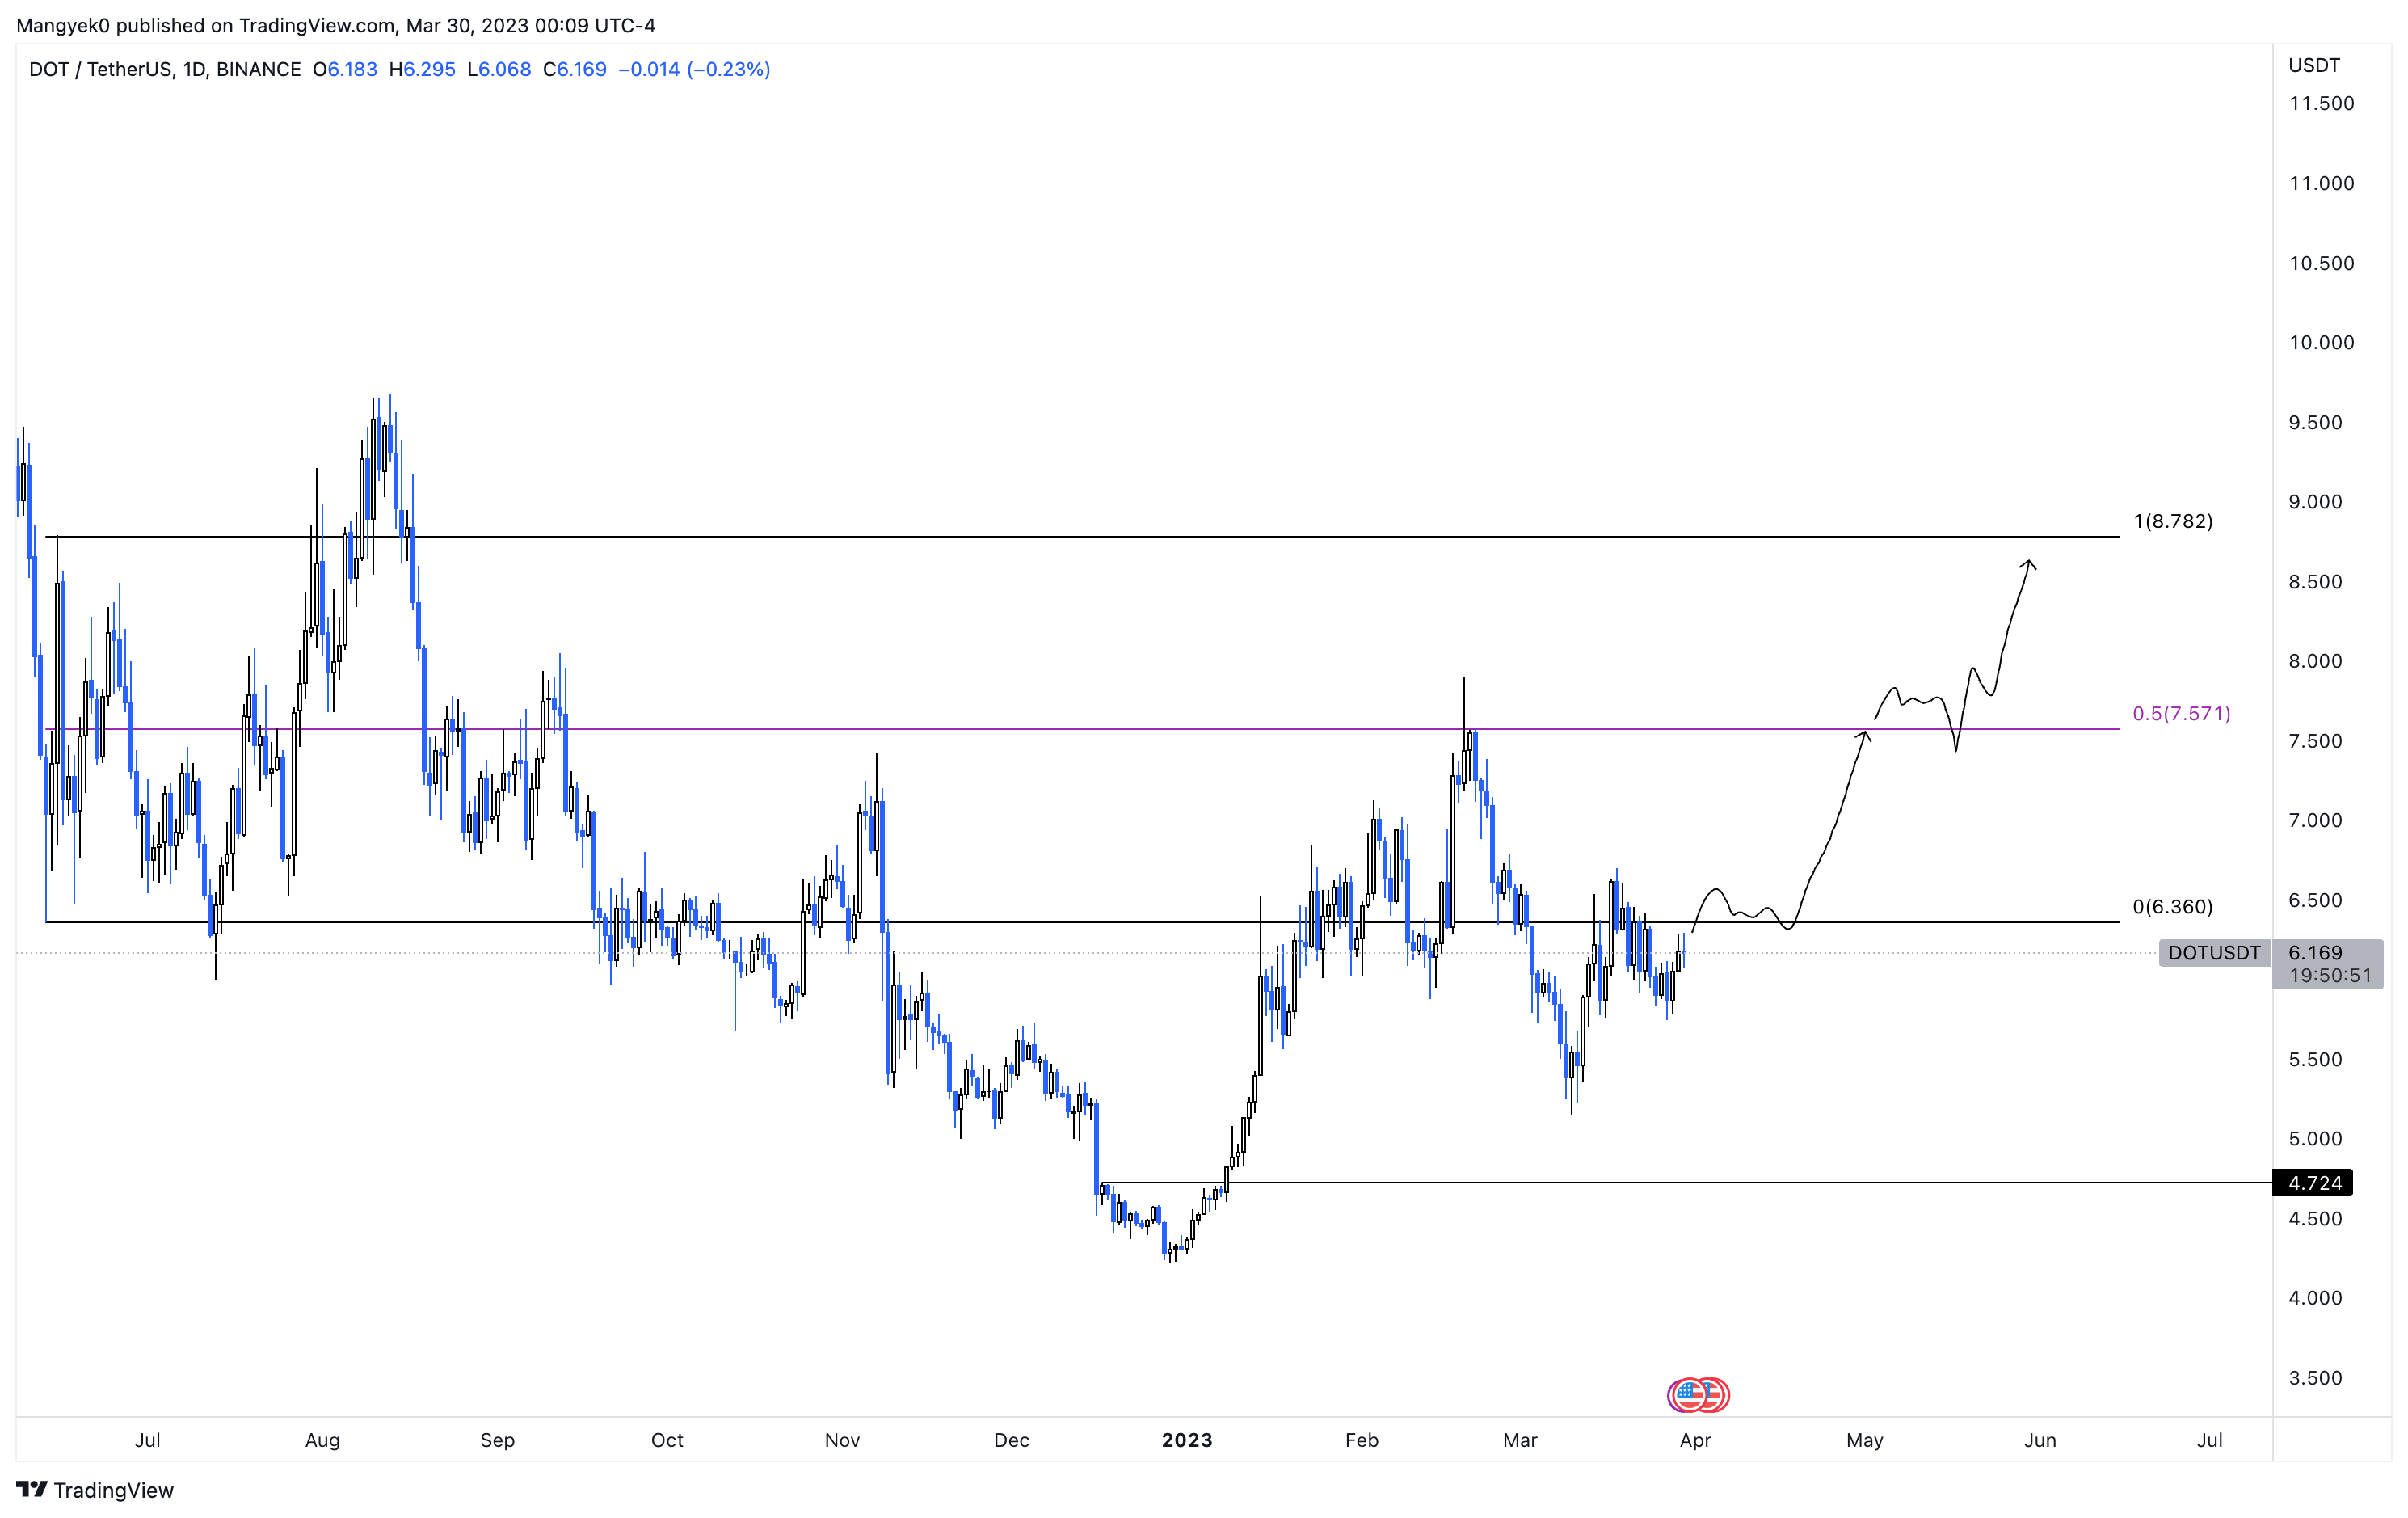
DOT/USDT 1-day chart
A four-hour chart shows that traders can capitalize on a much smaller rally for Polkadot price. Interested investors can accumulate DOT at the current level and look for acceptance above the long-term range’s lower level at $6.36.
A successful move would allow DOT to trigger a quick run-up and tag the 62% retracement level of the 35% crash witnessed between February and March 2023. This move would constitute a 10.6% gain for traders.
In some cases, Polkadot price might extend to retest the 70.5% retracement level at $7.08, bringing the total gain to 14.4%.
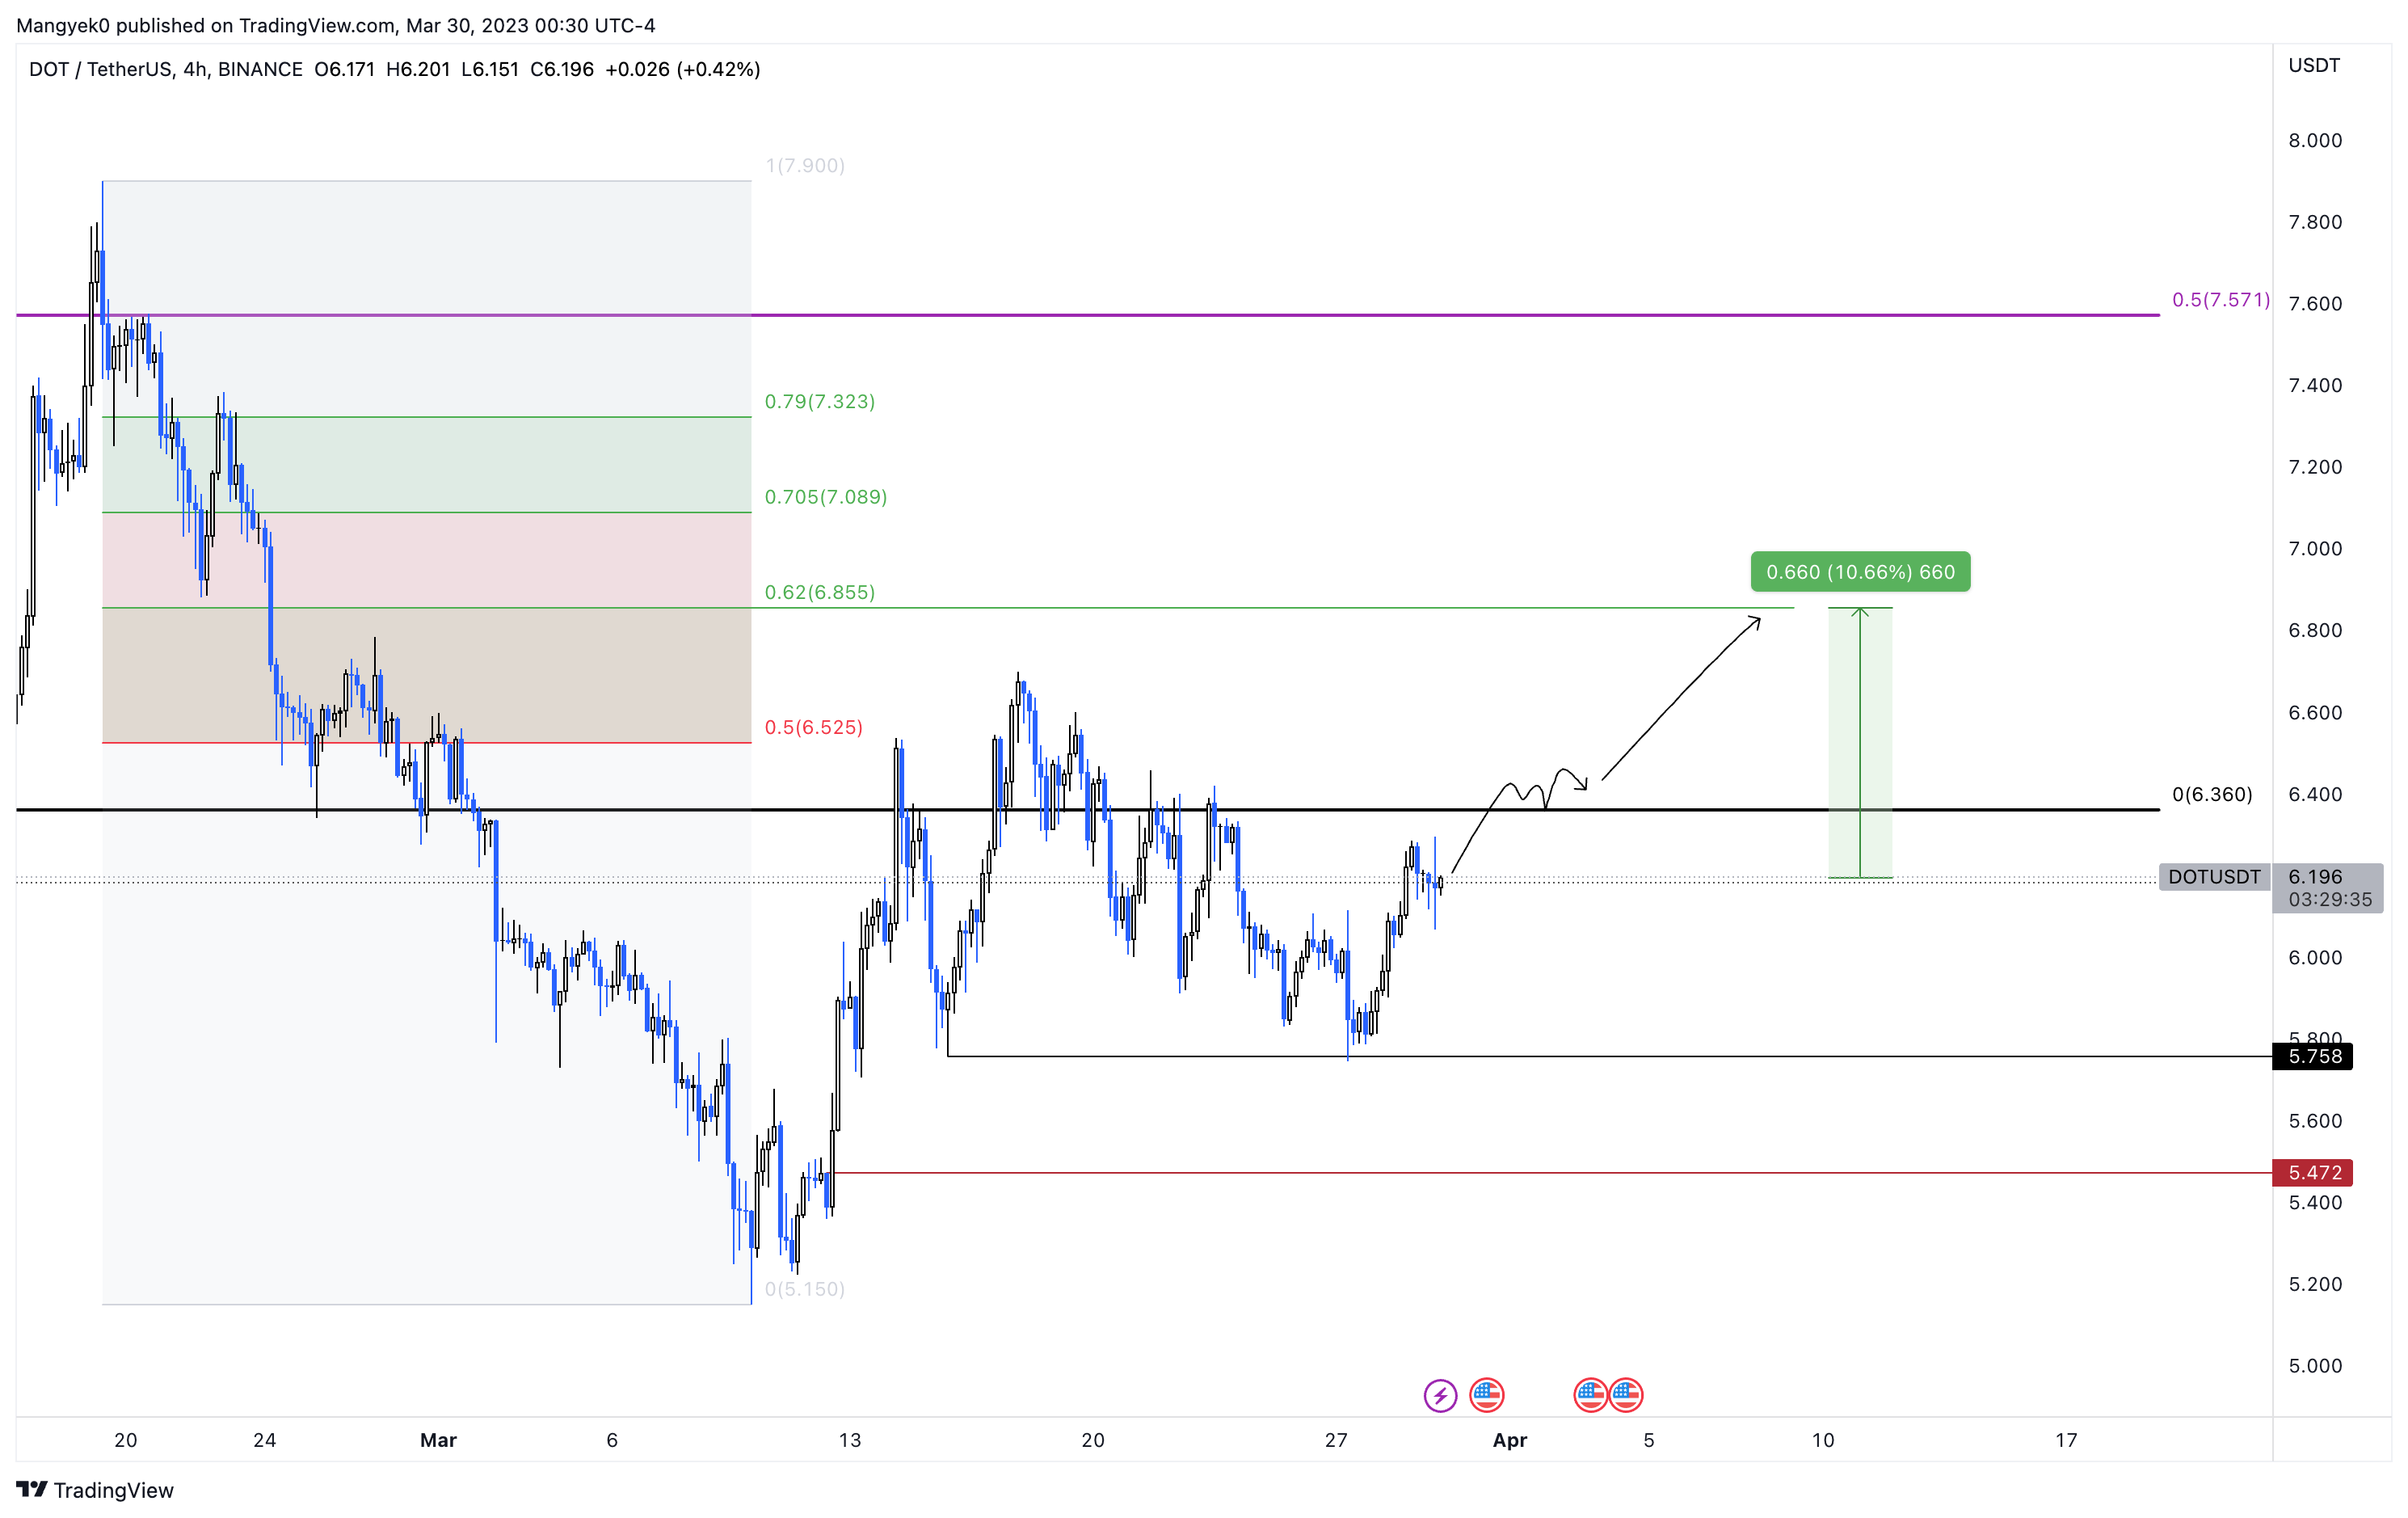
DOT/USDT 4-hour chart
Supporting this bullish outlook for Polkadot price is the Development Activity, which hit an all-time high of 358.57 on March 21. This index tracks the pure development-related activity by DOT developers in the project’s public GitHub repository.
This uptick from 117.14 on January 8 suggests that developers have been working on the improvement of the project. Often, investors consider this index as one of the signs before buying the project’s underlying token. A project that’s bustling with developer activity suggests a safe investment and a spike in development activity supports a bullish outlook for the underlying token.
 [09.42.24, 30 Mar, 2023]-638157508477144659.png)
DOT development activity
While the bullish outlook for Polkadot price is clear, investors should note that the invalidation level is $5.75. If this support structure is flipped into a resistance barrier, it would attract sellers and potentially trigger a 5% crash to $5.47.
Author

Akash Girimath
FXStreet
Akash Girimath is a Mechanical Engineer interested in the chaos of the financial markets. Trying to make sense of this convoluted yet fascinating space, he switched his engineering job to become a crypto reporter and analyst.


