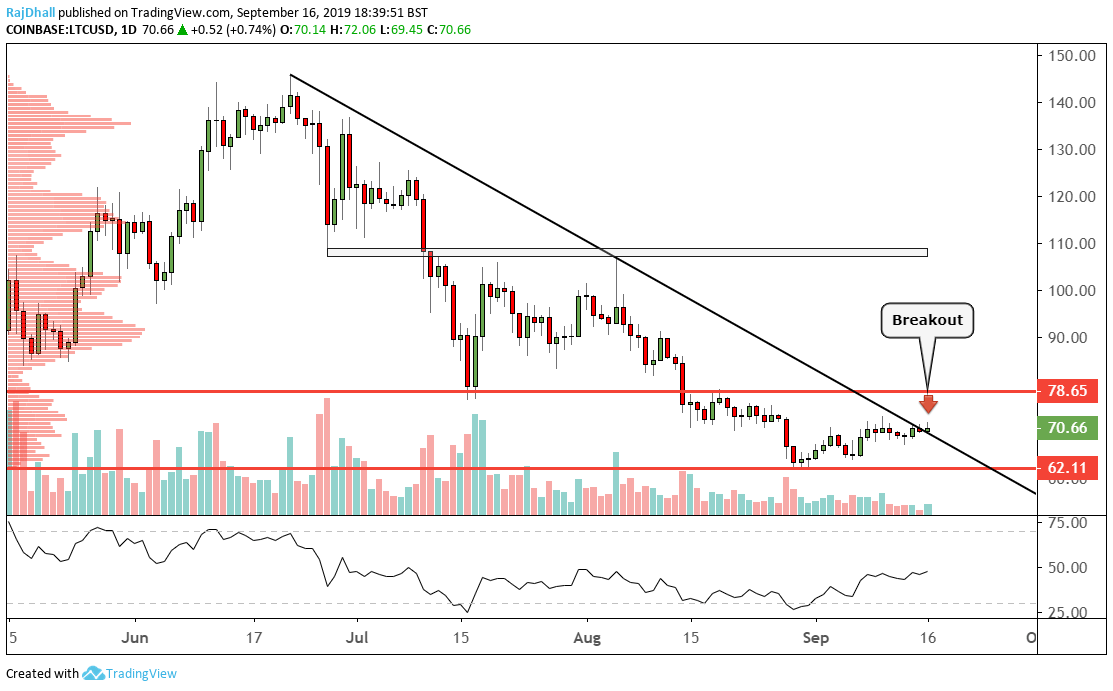
LTC/USD technical analysis: Long-term trendline has been broken
- Trendline which originated mid-June has broken to the upside.
- On the daily timeframe a flag formation is now in play.

There is a downtrend on the daily timeframe, and today there has been a break to the upside.
The trendline originated back in June and bounced off another wave high in August.
There has been a base forming with 62.11 the new support low.
On the upside 78.65 is now the main point of resistance and it was used as a big support zone on the 15th of July.
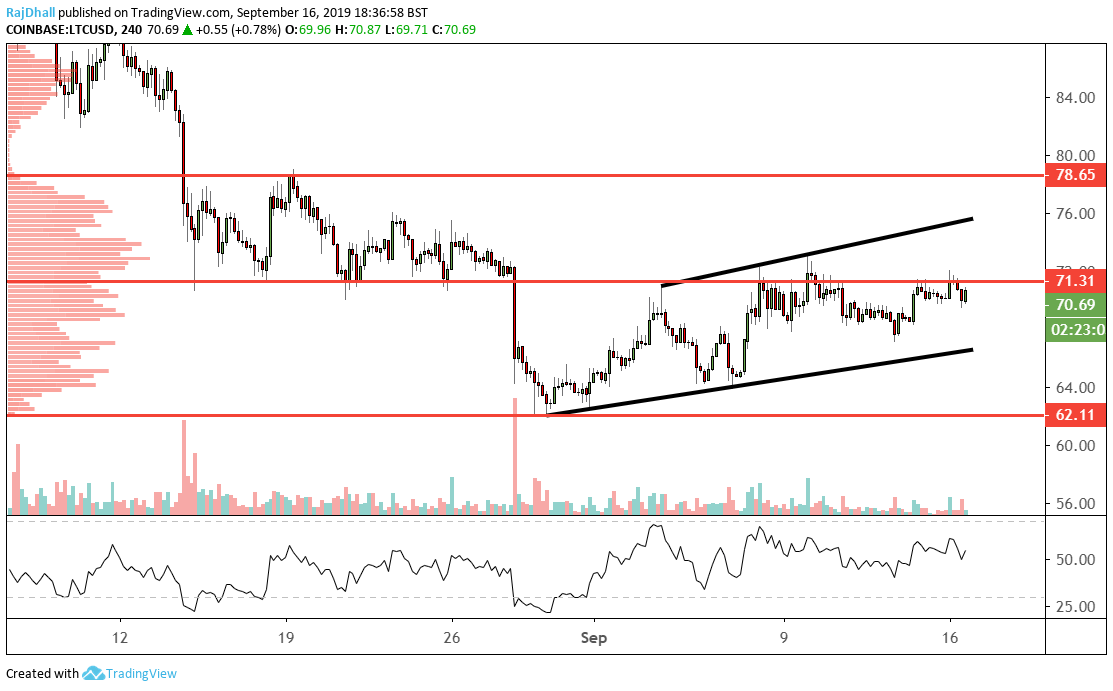
On the four hourly chart below, the flag formation looks to be heading to higher levels.
71.31 needs to be broken as it held as support yesterday.
The psychological 70 level on the downside has now been rejected on multiple occasions.
The relative strength indicator (RSI) is still above the 50 midline which could mean price still has room to move higher.
After basing out at 62.11, price made a few higher highs and higher lows.
The LTC/USD price still has some way to go to reach the mean value area of 72.86.
Author

Rajan Dhall, MSTA
FX Daily
Rajan Dhall is an experienced market analyst, who has been trading professionally since 2007 managing various funds producing exceptional returns.
More from Rajan Dhall, MSTA


