Litecoin price reaches primary target, LTC enters a period of turbulence
- Litecoin price closes in on the double bottom measured move price target of $191.00 after a 10.82% rip on August 13.
- LTC breaks away from the 50-week simple moving average (SMA) and logs the best weekly gain since the beginning of May.
- A bearish momentum divergence appears on the intra-day timeframes as the Relative Strength Index (RSI) does not confirm Litecoin price highs.

Litecoin price had been paralyzed by the 2019 high at $146.00 and the 50-week SMA from the end of June until this week as LTC finally broke away from the resistance with the best weekly performance since the beginning of May. The move’s strength propelled the cryptocurrency near the double bottom measured move price target of $191.00 and the 200-day SMA at $192.72. With firm resistance in place and the presence of a bearish momentum divergence on the intra-day timeframes, Litecoin price upside may be constrained in the short term as it reconciles the divergence and overbought condition through a pause or correction.
Litecoin price climbs the wall of worry with a 70% return
The breakout from the double bottom pattern on August 7 marked the next leg higher for Litecoin price and an elevated level of rally impulsiveness that has inspired LTC to virtually test the 30.04% measured move price target of $191.00 today. However, today’s high was not confirmed by the RSI on the nine-hour chart, suggesting that the cryptocurrency is approaching a mild decline that will tag the July ascending trend line around $163.92, specifying a 10% retracement from the current price.
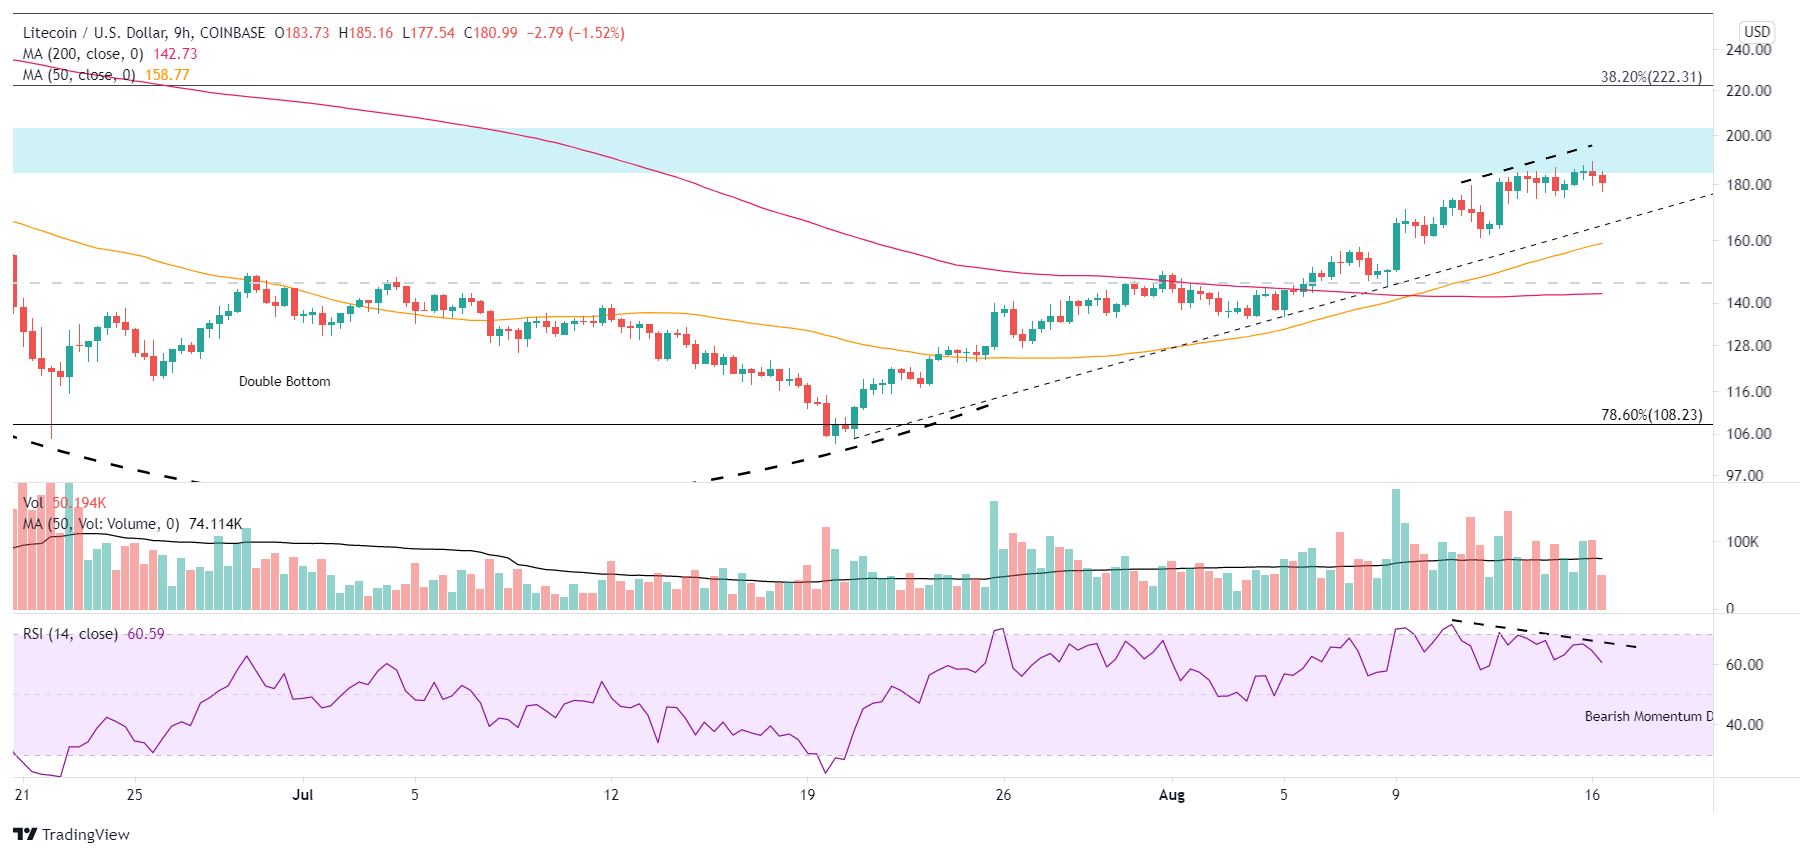
LTC/USD 9-hour chart
A pullback would be a normal development based on the resistance aligned around the current price and the overbought condition on the daily RSI due to a 70% rally from July 21. Suppose the Litecoin price slump records a daily close below the July ascending trend line. In that case, it will encourage further selling down to the 2019 high at $146.00 and pressure ETC investors with a complicated bottoming process that may extend for weeks. For now, that scenario is an outlier.
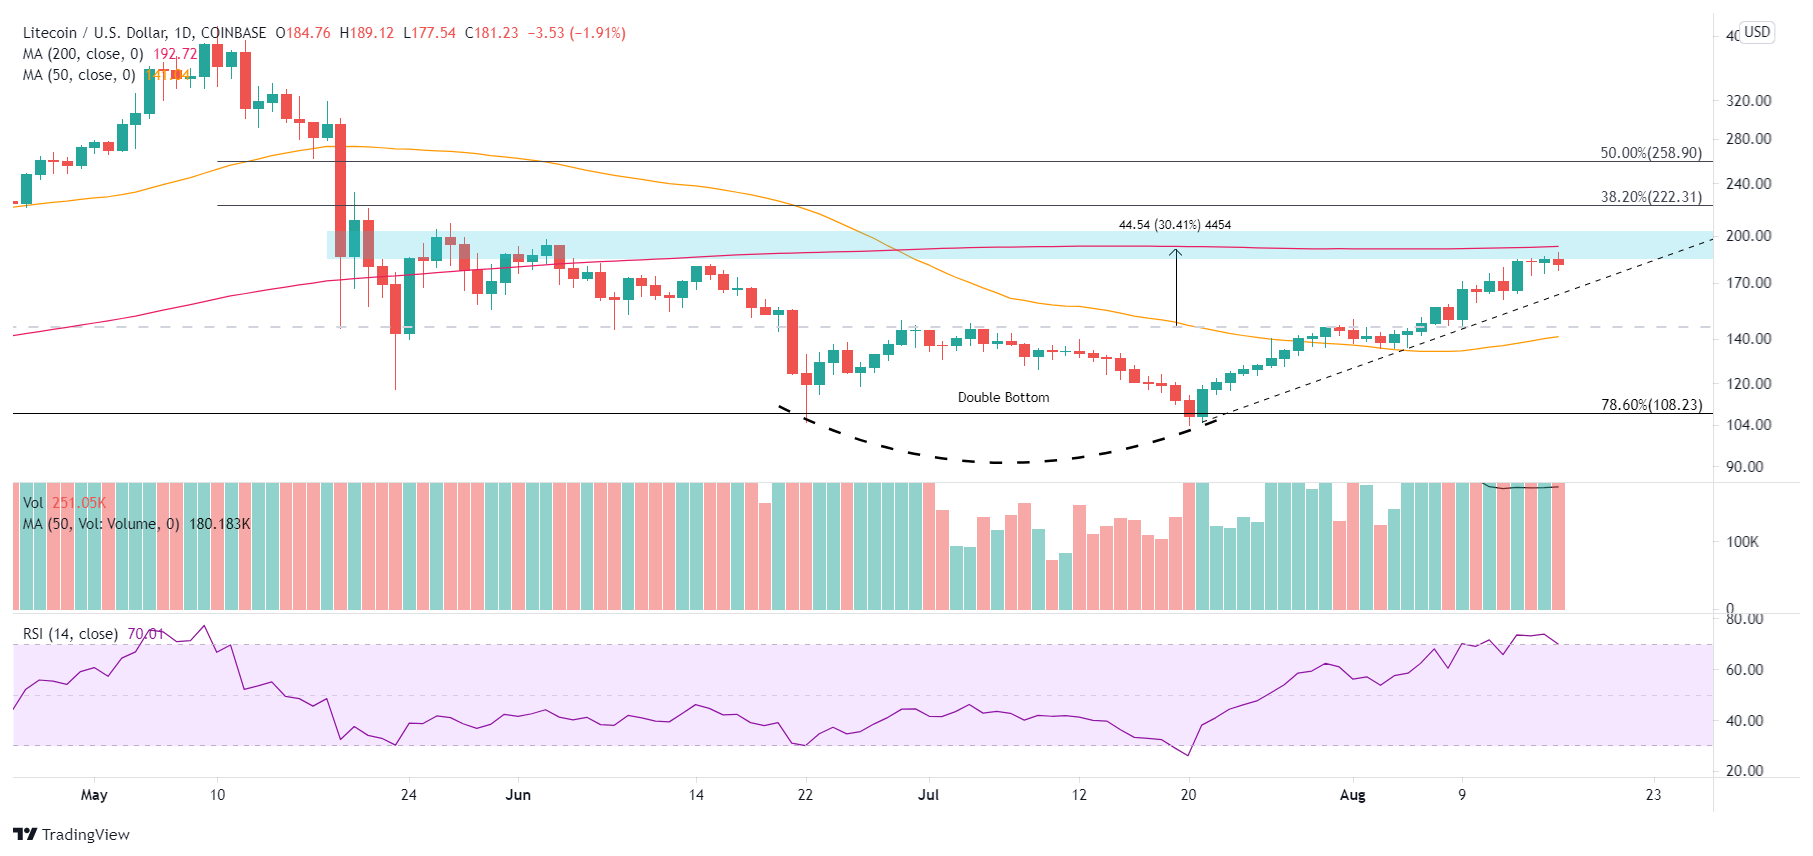
LTC/USD daily chart
The pursuit of bigger price outcomes in the altcoins could sustain the Litecoin price rally beyond the 200-day SMA at $192.72 and the price congestion between $184.00 and $204.00 before LTC is obstructed by the 38.2% Fibonacci retracement of the May-July correction at $222.31.
Litecoin price has not accomplished the remarkable gains of other cryptocurrencies. Instead, it has been on autopilot since July 21, with only seven negative days and the largest loss being only -3.95% on August 8. Nevertheless, the new LTC wave higher has collided with significant resistance as it is losing momentum, presenting a short-term challenge and the basis for a setback.
Here, FXStreet's analysts evaluate where LTC could be heading next after breaking crucial resistance.
Author

Sheldon McIntyre, CMT
Independent Analyst
Sheldon has 24 years of investment experience holding various positions in companies based in the United States and Chile. His core competencies include BRIC and G-10 equity markets, swing and position trading and technical analysis.


