Litecoin price looks to $300 and beyond amid a potential bull flag
- Litecoin bulls look to fight back control, with eyes on the six-month top.
- LTC price spots a bull flag on the 12H chart, awaits confirmation.
- RSI stalls its descent while above 50.00, underpinning the buying mood.

The corrective decline in Litecoin price appears to have lost steam from six-month highs of $298, as LTC bulls look to regain control this Saturday.
LTC price is attempting a tepid bounce from three-day lows of $244 reached Friday, currently trading at $251, almost unchanged on the day.
Despite the recent pullback from the multi-month top, the underlying bullish tone in Litecoin remains untouched amid encouraging fundamentals.
“Based on data from crypto intelligence platform IntoTheBlock, 88% of the wallet addresses holding Litecoin are currently profitable,” FXStreet’s Crypto Editor Ekta Mourya noted.
Adding credence to the bullish potential, a renowned forex trader and analyst Peter Brandt said that he expects LTC price to retest 2021 high at 395.
LTC price eyes further upside amid a potential bull flag
This week’s consolidative mode that followed Litecoin’s uptrend from November 6 lows of $191 to half-year highs has carved out a bull flag formation on the 12-hour chart.
LTC bulls need a sustained break above the falling trendline resistance at $264 to validate the bullish continuation.
A fresh upswing will then kick in towards the multi-month highs, which remain in close proximity to the $300 mark.
On buying resurgence, LTC price could look to challenge the $350 psychological level. Further up, the pattern target measured at $371 will be on LTC buyers’ radars.
A test of the $400 round number will be inevitable should LTC bulls find a strong foothold above the latter.
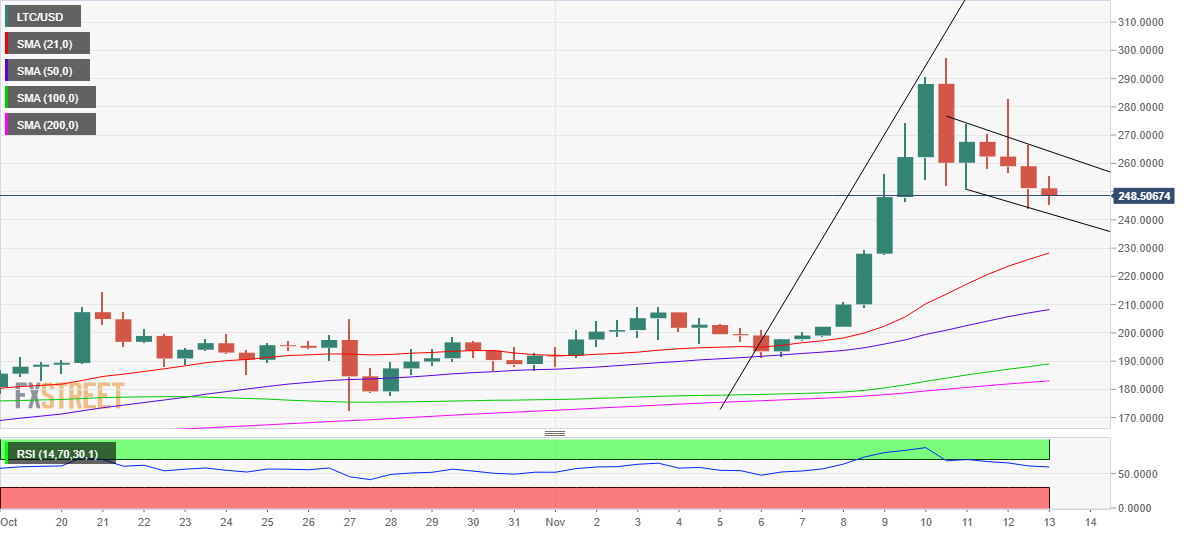
LTC/USD: 12-hour chart
On the flip side, if the selling momentum resumes, then the falling trendline support at $242 could be put at risk.
A 12-hourly candlestick closing below it would wipe out the expectations for a bull flag, opening up the additional downside towards the bullish 21-Simple Moving Average (SMA) at $228.
The next critical cushion is aligned at $208, which is the upward-sloping 50-SMA.
Author

Dhwani Mehta
FXStreet
Residing in Mumbai (India), Dhwani is a Senior Analyst and Manager of the Asian session at FXStreet. She has over 10 years of experience in analyzing and covering the global financial markets, with specialization in Forex and commodities markets.


