Litecoin price has a long way to go before LTC attempts to tag $85
- Litecoin price is likely to slide 10% before holders can consider accumulating.
- A sweep of the range low at $56 will be the first sign that LTC is forming a bottom.
- A quick recovery above $56, coupled with the shift in market structure, will confirm a potential bounce play.
- This development could see LTC rally 52% and tag the range’s midpoint at $85.

Litecoin (LTC) price has not shown strength after the January 3 crash, indicating that investors are engrossed in the newer coins. If the crypto market continues to move sideways, LTC is likely going to slide lower before any buyers show up.
Also read: Bitcoin spot ETF approval could come as soon as Tuesday, new filings hint
Litecoin price likely to shed more weight
Litecoin price created a range, extending from $56 to $115, as it crashed 51% between July 3, 2023 and August 17, 2023. Since then, LTC has hardly recovered and has largely traded below the midpoint at $85.
After its breakout from the wedge formation, Litecoin price crashed 13% and currently trades at $64. The lack of LTC bulls is likely going to push the altcoin lower to target the liquidity resting below equal lows formed on September 11, 2023, and January 3 at $57 and the range low of $56.
A sweep of the aforementioned level is where smart money is likely to step in. If Litecoin price recovers above the range low of $56 and produces a higher high above the last key swing high, it would confirm the emergence of bulls. In such a case, LTC is likely to kickstart a 23% rally to the daily resistance level of $68.
A flip of this level could see Litecoin price attempt a retest of the weekly resistance level at $77 and, subsequently, the range’s midpoint of $85.
Due to the potential ETF approval next week, investors need to be cautious of heightened volatility. The above-explained sweep and reclaim of the range low could occur in a single daily candlestick.
Also read: XRP price falls to two-month lows despite Grayscale adding Ripple to its Digital Large Cap Fund
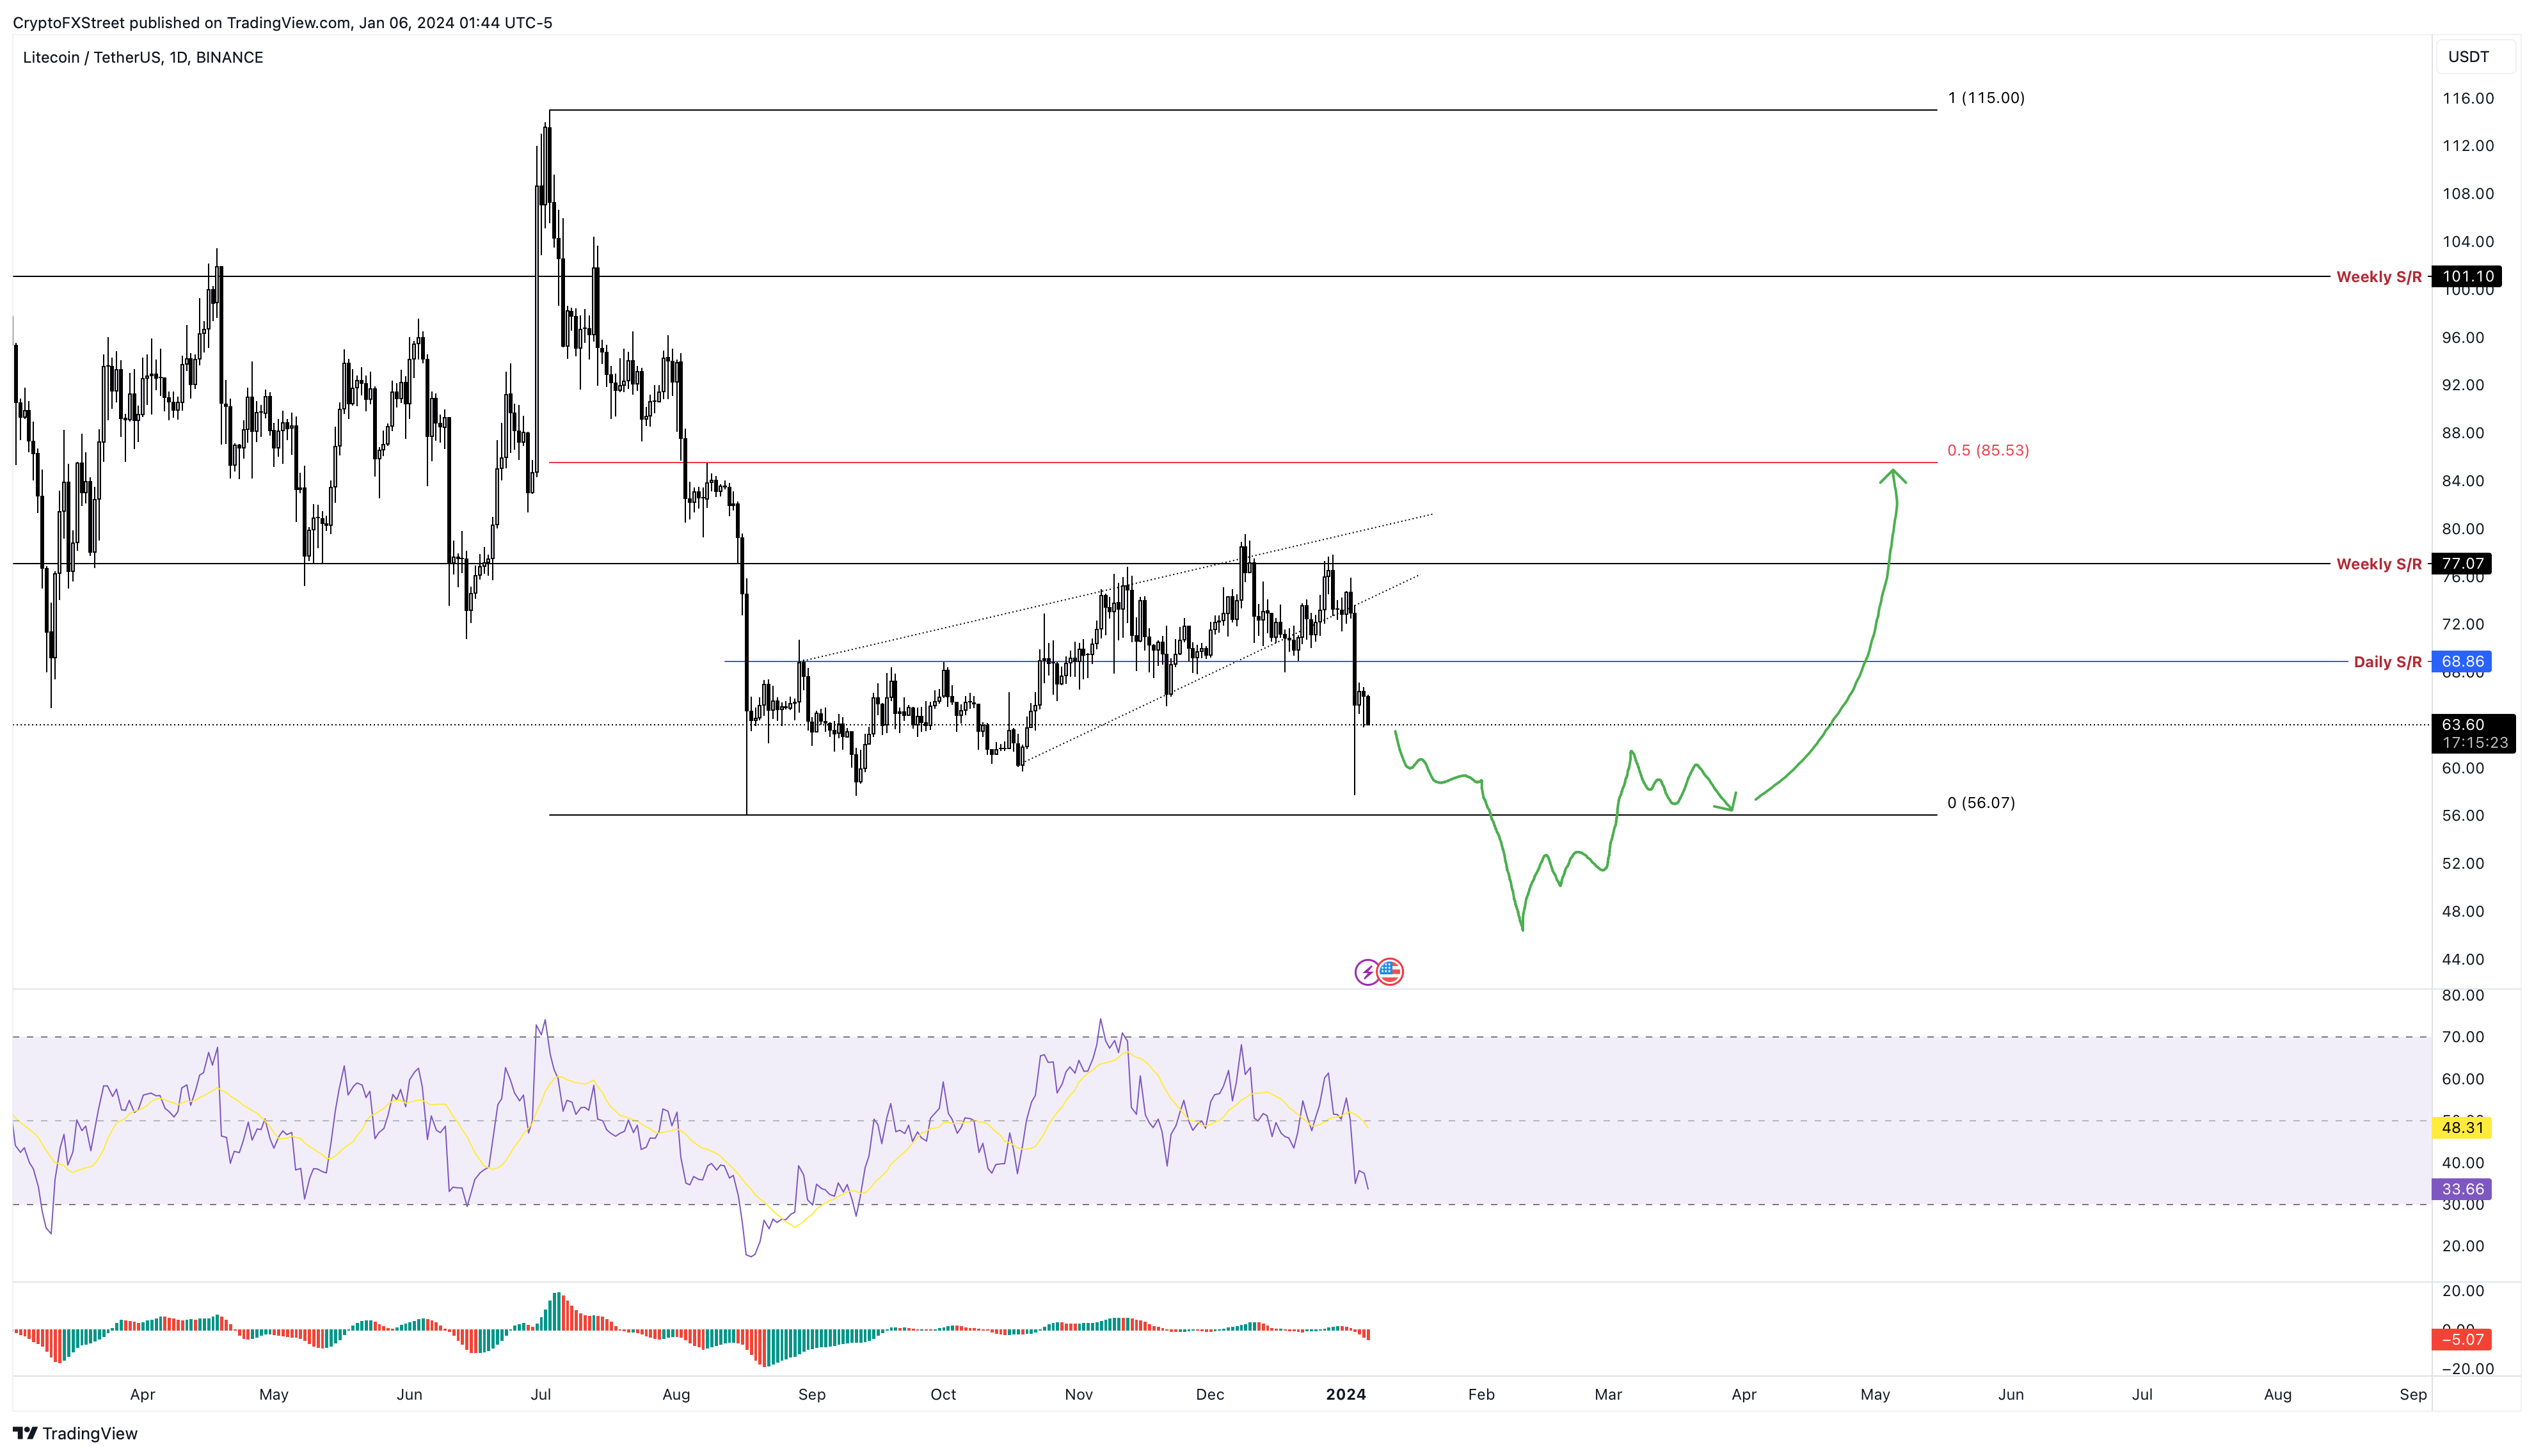
LTC/USDT 1-day chart
On the other hand, if Litecoin price is rejected at the range low of $56, it will invalidate the bullish thesis. In such a case, LTC could continue heading lower and tag the $50 psychological level after a 10% correction.
Author

Akash Girimath
FXStreet
Akash Girimath is a Mechanical Engineer interested in the chaos of the financial markets. Trying to make sense of this convoluted yet fascinating space, he switched his engineering job to become a crypto reporter and analyst.



