Litecoin Price Forecast: LTC reveals second opportunity with 18% upside
- Litecoin price steadies at the 78.6% Fibonacci retracement level after nine consecutive down days.
- On July 21, LTC records the best day since the May 31 gain of 10%.
- The digital asset is positioned below the 50-week simple moving average (SMA), forecasting a challenging long-term recovery.

Litecoin price recorded nine consecutive down days and an oversold reading on the daily Relative Strength Index (RSI) before the 9.8% gain on July 21. The rebound from the 78.6% retracement level of the 2020-2021 advance marked the second time the cryptocurrency bounced at that level over the past month, confirming it as legitimate support moving forward. More importantly, LTC is constructing a new, timely entry price to accommodate those investors arriving late.
Litecoin price shapes new base structure
Litecoin price has quietly molded a falling wedge pattern with exceptional support at the confluence of the 78.6% retracement level at $108.23 and the June 22 low of $105.00. The falling wedge emphasizes waning momentum in the decline and the potential for a bullish LTC outlook.
During the 9.8% burst higher on July 21, Litecoin price triggered an entry price highlighted in an FXStreet article on July 20 at $115.06. The successful breakout above $115.06 was a timely opportunity for investors. Still, LTC may be establishing a new, actionable opportunity, as it is shaping a cup-with-handle base on the four-hour chart. The handle is finding support a long the 50 four-hour SMA, currently at $117.97.
The current entry price for the new structure is the high of the handle at $122.24, and the measured move of the base is nearly 18%, presenting a price target of $143.79. A rally of that size would break Litecoin price out of the falling wedge pattern, overcome resistance at the 50-day SMA at $142.52 and leave LTC just below the critical barrier formed by the 2019 high of $146.00.
For those LTC investors that capitalized on the $115.06 trigger, it would represent a 25% profit.
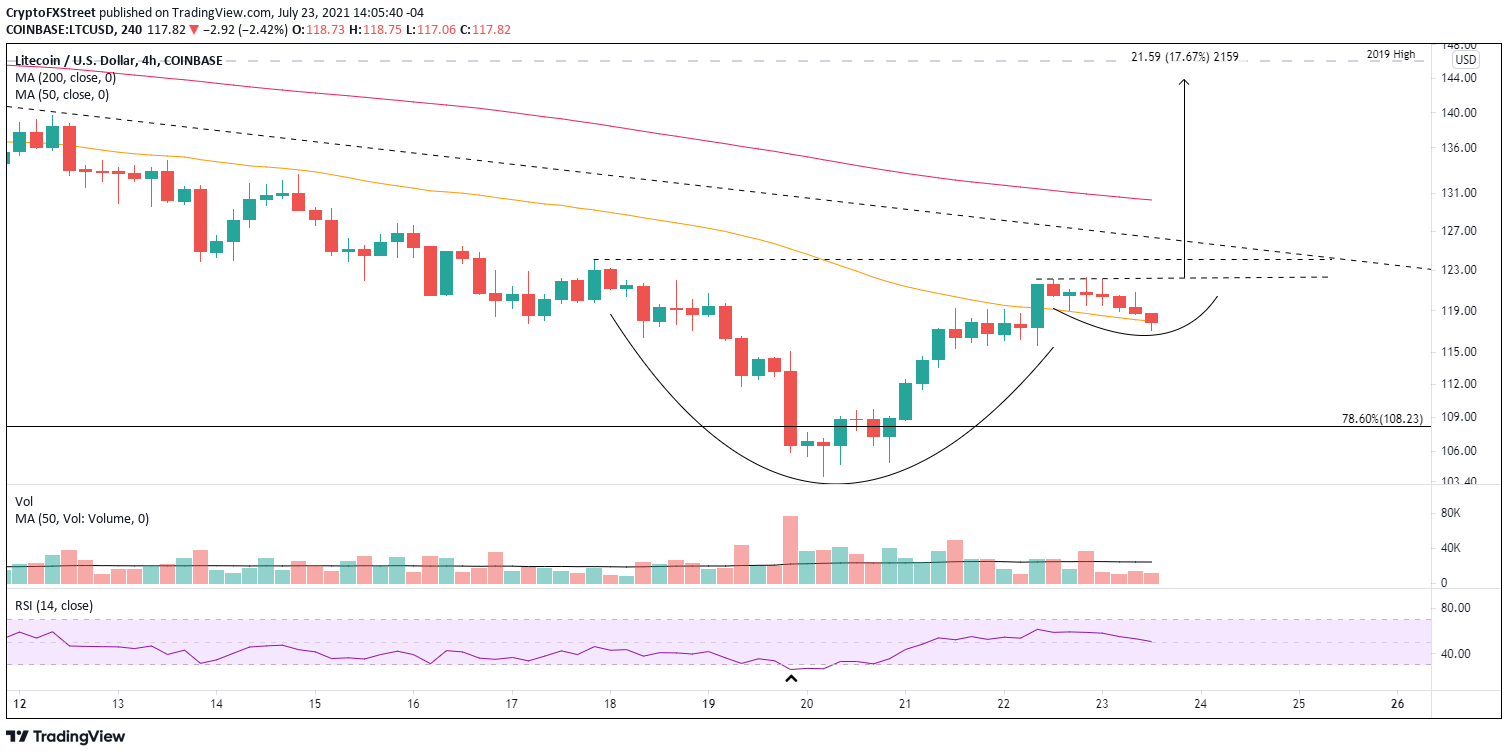
LTC/USD 4-hour chart
Of course, Litecoin price could suffer a sell-off, but it may create another opportunity. On a pullback, LTC investors can use the 78.6% retracement level at $108.23 as a point of entry, with the July 20 low of $103.88 as the stop. Any weakness beyond the July 20 low would signal a drop to the falling wedge’s lower support line at $94.00.
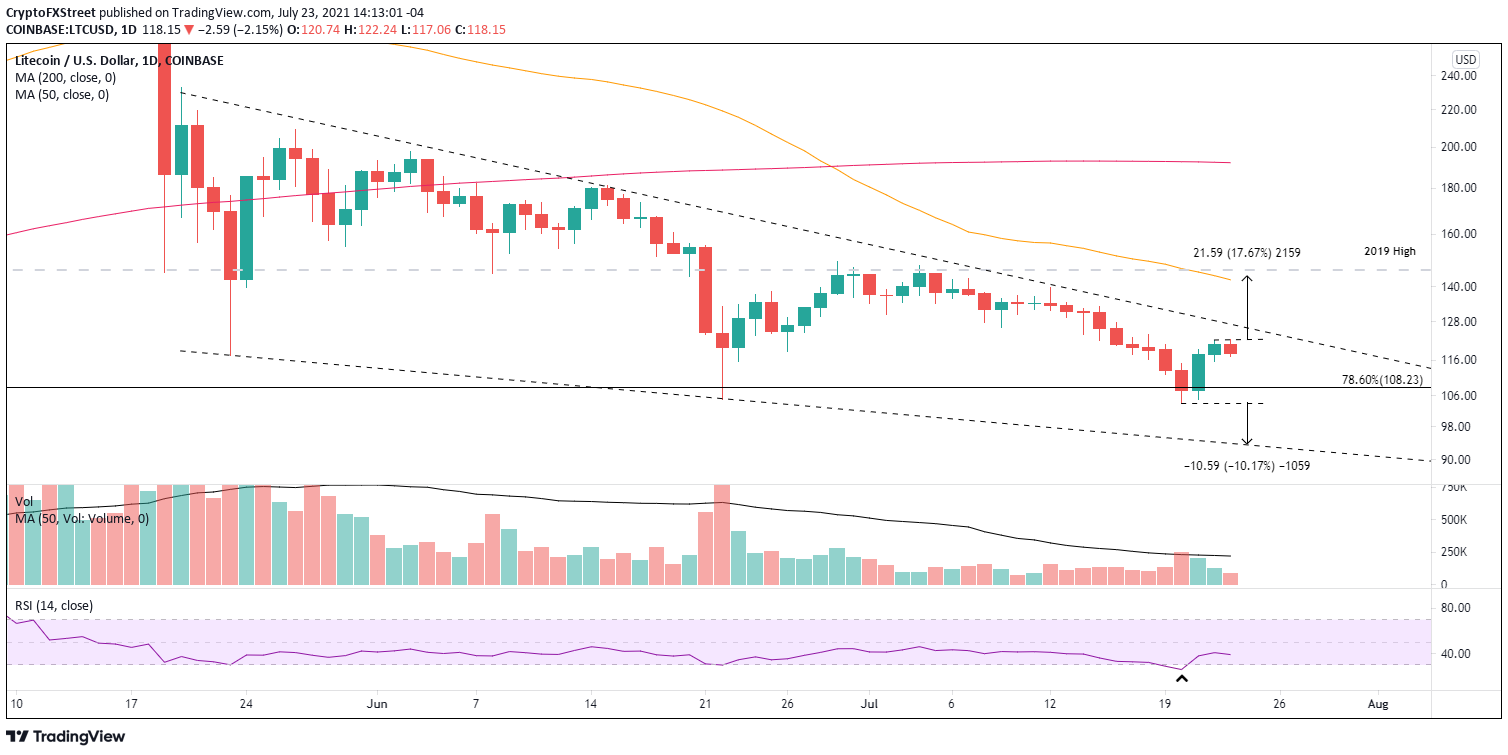
LTC/USD daily chart
LTC is not the most compelling opportunity in the cryptocurrency complex. However, the availability of a secondary entry price with the cup-with-handle base does offer a fresh, high probability entry price. For sure, it is better than chasing Litecoin price and exposing capital to unnecessary volatility and losses.
Here, FXStreet's analysts evaluate where LTC could be heading next.
Author

Sheldon McIntyre, CMT
Independent Analyst
Sheldon has 24 years of investment experience holding various positions in companies based in the United States and Chile. His core competencies include BRIC and G-10 equity markets, swing and position trading and technical analysis.


