|

Litecoin Chart Analysis: Fierce barrier at $50 challenges LTC bulls’ commitment

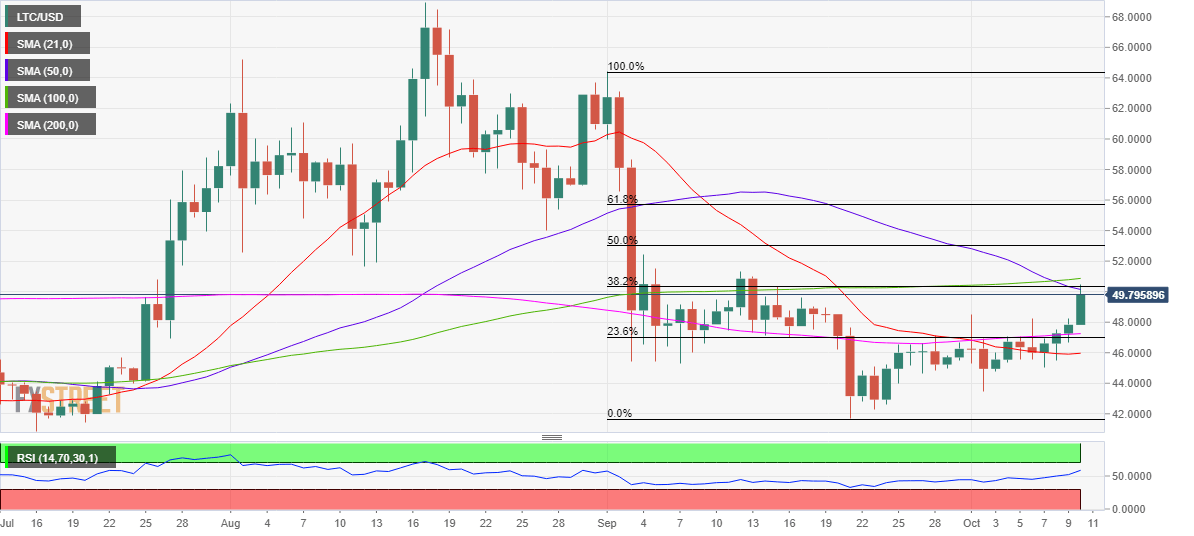
  • LTC/USD battles a cluster of key resistance levels at $50.
  • Daily RSI inches higher above the midline, more gains likely?
  • 200-DMA to offer support to LTC bulls in the near-term.

Following the relentless advance for four straight sessions, Litecoin (LTC/USD) buyers are facing some exhaustion at $50 levels on Saturday.

The resistance zone is a strong confluence of the bearish 50-day moving average (DMA), horizontal 100-DMA and 38.2% Fibonacci Retracement level of the sell-off from the September 1 high of $64.39 to the September 21 low of 41.67.

Only a decisive break above the aforementioned level would help accelerate the recent gains towards the next relevant hurdle at the 50% Fibonacci Retracement of the same decline, which is at $53.07.

The 14-day Relative Strength Index (RSI) holds firmer above the midline, leaving scope for more gains. However, it could probably be tough for the bulls to extend their control.

To the downside, the intersection of the 200-DMA and 23.6% Fibonacci Retracement level just above the $47 mark could act as strong support.

Should the bears manage to clear that level, the 21-DMA cushion at $45.96 could get tested.

LTC/USD: Daily chart
LTC/USD: Additional levels to consider

LTC/USD

Overview
Today last price49.6730
Today Daily Change1.8433
Today Daily Change %3.85
Today daily open47.8298
 
Trends
Daily SMA2045.776
Daily SMA5050.3283
Daily SMA10050.7568
Daily SMA20047.1806
 
Levels
Previous Daily High48.216
Previous Daily Low46.6529
Previous Weekly High48.2294
Previous Weekly Low45.0532
Previous Monthly High64.3919
Previous Monthly Low41.6767
Daily Fibonacci 38.2%47.6189
Daily Fibonacci 61.8%47.25
Daily Pivot Point S146.9165
Daily Pivot Point S246.0032
Daily Pivot Point S345.3534
Daily Pivot Point R148.4795
Daily Pivot Point R249.1293
Daily Pivot Point R350.0426

Author

Dhwani Mehta

Dhwani Mehta

FXStreet

Residing in Mumbai (India), Dhwani is a Senior Analyst and Manager of the Asian session at FXStreet. She has over 10 years of experience in analyzing and covering the global financial markets, with specialization in Forex and commodities markets.


More from Dhwani Mehta
Share:

Editor's Picks

Ripple slips below $1.30 as sellers tighten grip

Ripple (XRP) hovers below $1.30 on Tuesday, held down by a weakening technical structure. The broader crypto market remains bearish ahead of the Federal Reserve’s (Fed) October 28 monetary decision.

Crypto Today: Bitcoin, Ethereum, XRP tick lower amid mixed ETF flows

Bitcoin is trading above $81,000 on Tuesday, aligning with a lethargic tone in the broader cryptocurrency market. Altcoins, including Ethereum and Ripple, reflect Bitcoin’s lock-step price action, trading below $2,400 and $1.30, respectively.

Pi Network extends losses as social interest declines

Pi Network (PI) is down nearly 2% on Tuesday, extending the previous day’s losses and risking an extended decline toward its record low of $0.0704. PI token’s social dominance score is down to a six-month low, suggesting reduced social interest.

NEAR Protocol Price Forecast: Mild correction persists despite resilient ETF inflows

NEAR Protocol (NEAR) price is down nearly 2% on Tuesday, mirroring its 2% decline from the previous day. Institutional demand remains firm, with Bitwise’s NEAR-focused Exchange Traded Fund (ETF) recording over $5 million in inflows on Monday.

Bitcoin: Macroeconomic headwinds, cooling demand cap BTC gains
Bitcoin (BTC) extends losses this week, trading below $82,500 as of Friday as selling pressure continues. Weakening institutional demand supports this pullback as BTC spot Exchange-Traded Funds (ETFs) are on track to record a two-week withdrawal streak, reaching $146.19 million in net outflows through Thursday.