Lido DAO price could nosedive 40% if this LDO setup breaks out
- Lido DAO price shows a head-and-shoulders setup forming on the three-day chart,
- A three-day candlestick close below $2.00 will trigger a 38% crash to $1.25.
- Invalidation of the bearish thesis will occur if LDO produces a three-day candlestick close above $2.62.
Lido DAO (LDO) price shows a clear formation of a top reversal set up on the three-day charts. The LDO token is hovering dangerously close to a breakout level that opens the floodgate of selling pressure.
Also read: Lido DAO Price Forecast: LDO could rise 30% ahead of the Shanghai Upgrade
LidoDAO price reveals a pessimistic outlook
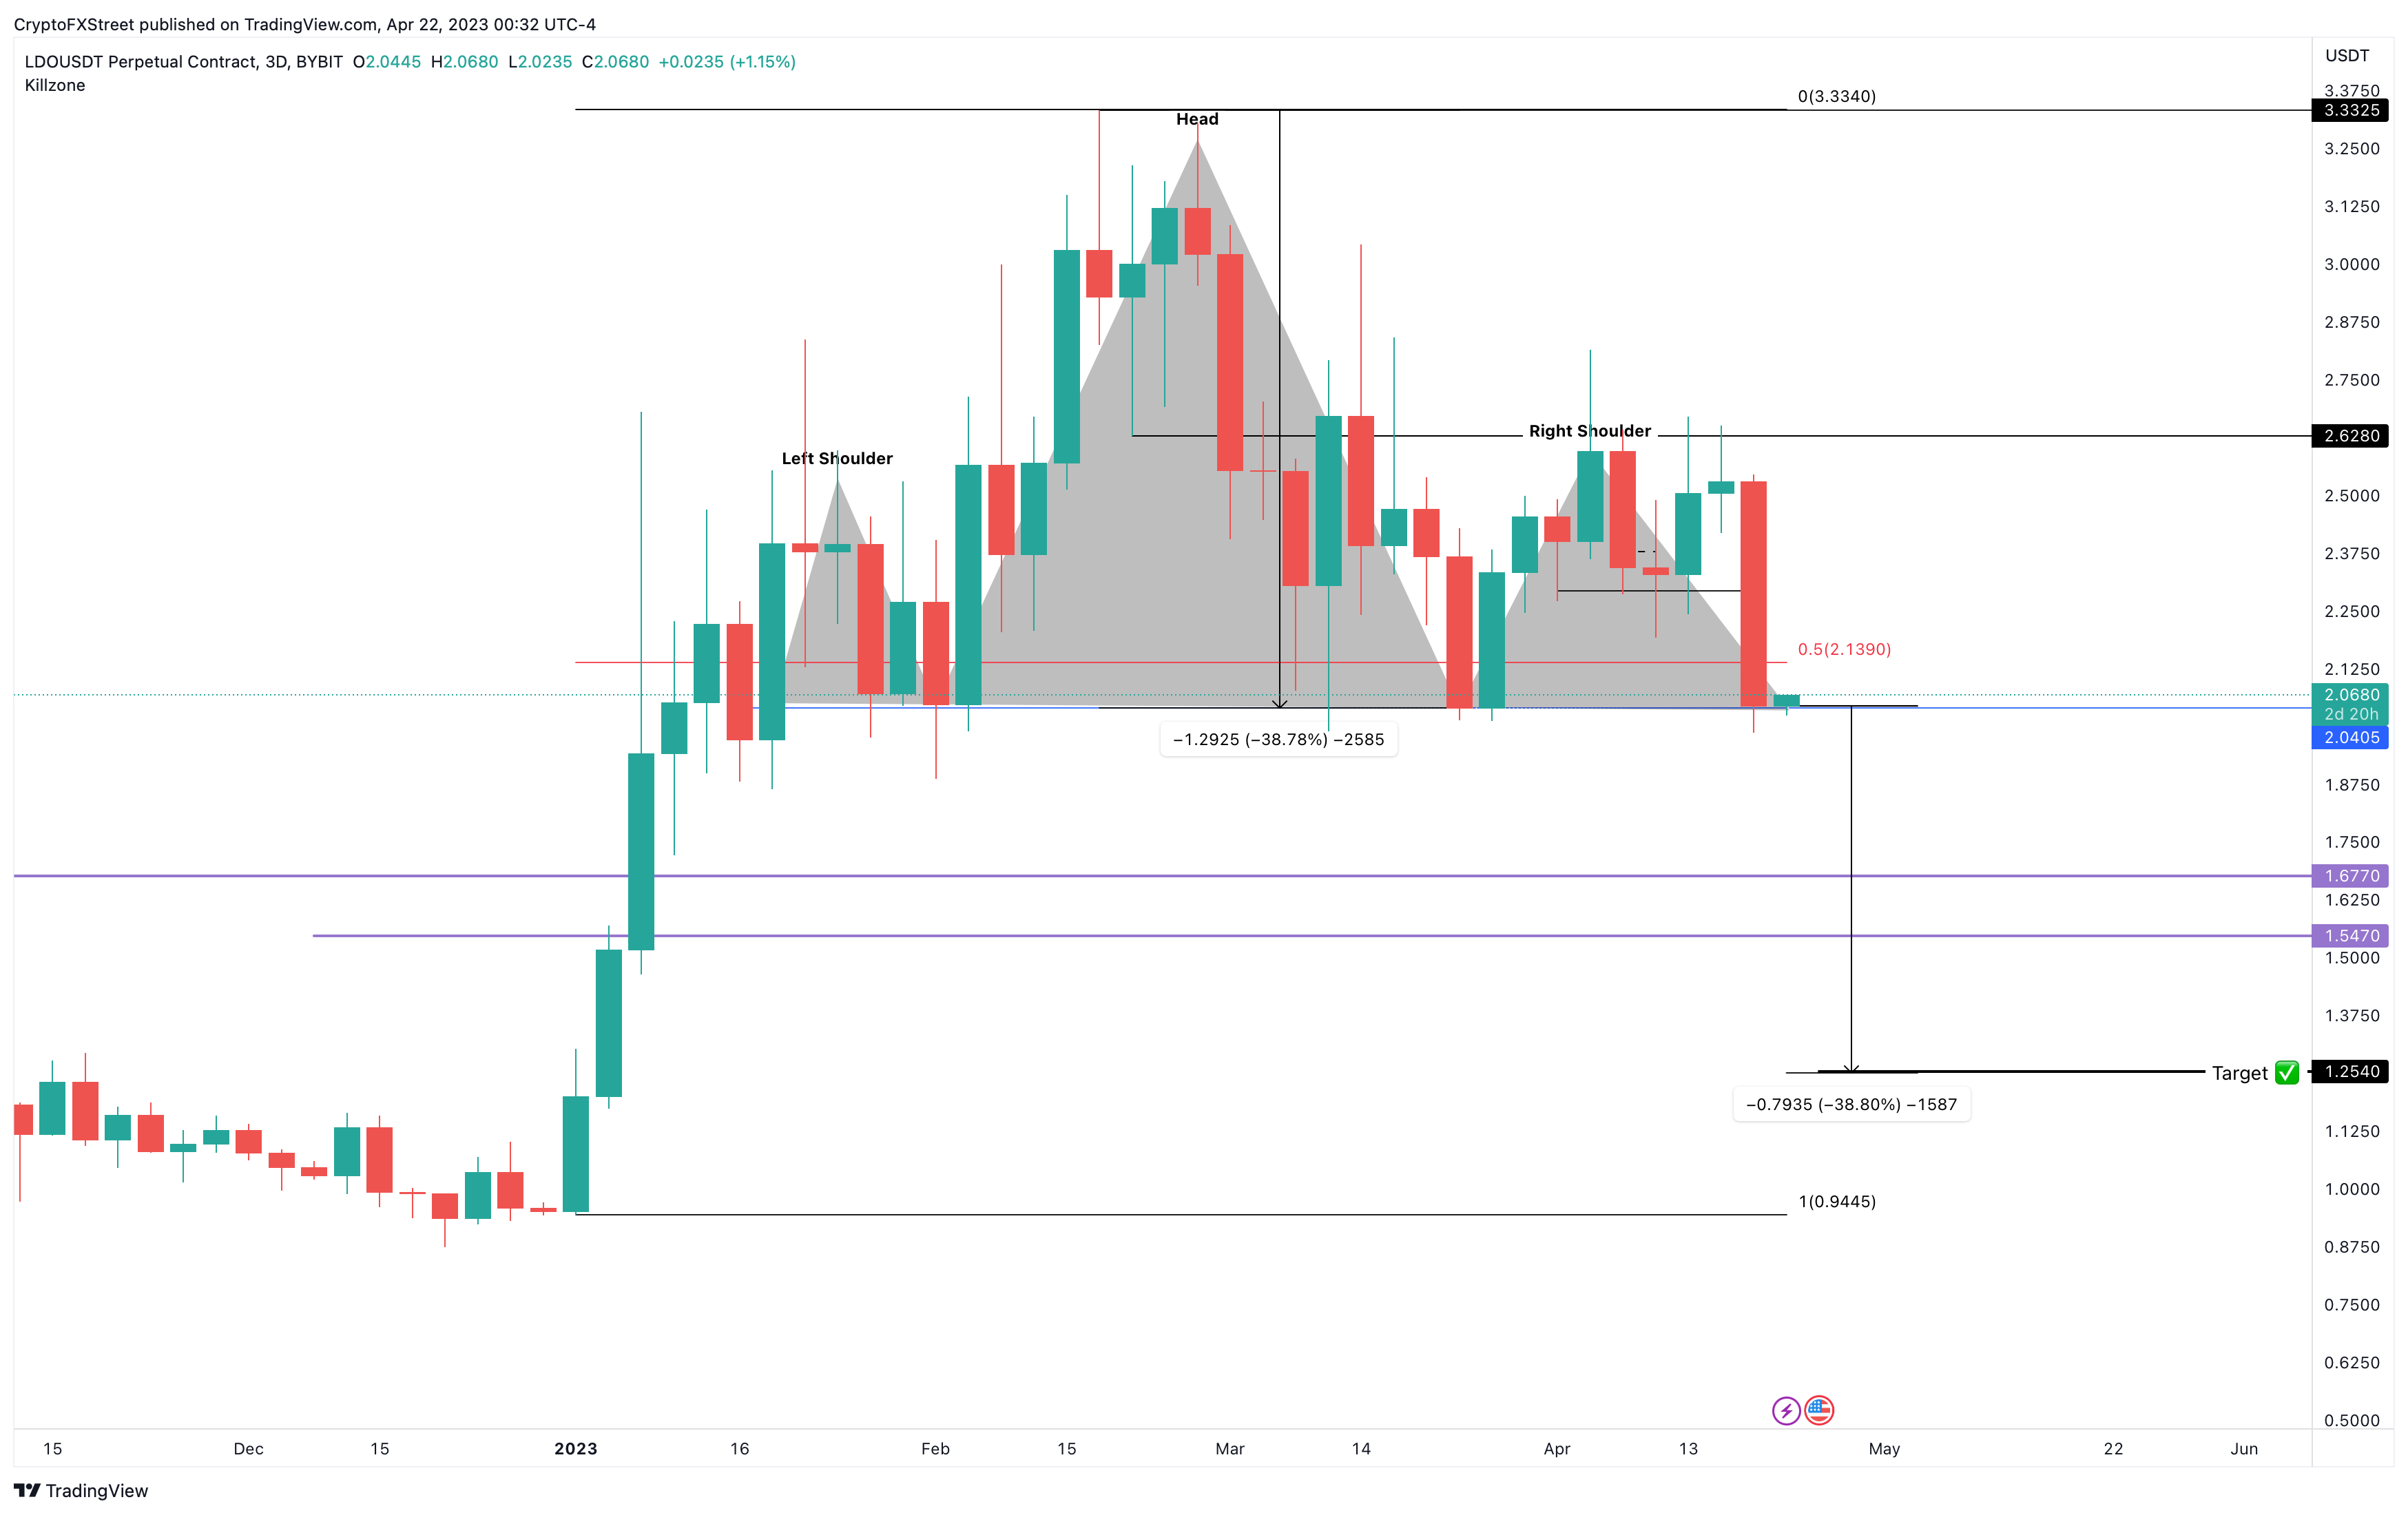
Lido DAO (LDO) price has formed a head-and-shoulders setup on the three-day chart. The pattern that spans all the way up to January 2023 contains three distinctive peaks. The central one is termed the head, while the ones on either side are named shoulders and are of relatively equal heights. The valleys of the three peaks can be connected using trend lines to reveal a horizontal support level known as the neckline.
A decisive break of this neckline will trigger a bearish descent, The setup’s target is obtained by adding the distance between the head’s peak and the neckline to the breakout point at $2.04 to reveal the target of $1.25.
If the ongoing bearish outlook continues for the crypto ecosystem, Lido DAO (LDO) price is likely to slide below the neckline at $2.04. In such a case, investors need to observe the $1.67 and $1.54 levels for support. A breakdown of these two support structures would send LDO to the theoretical target of $1.25.
LDO/USDT 1-day chart
Regardless of the bearish outlook, if Bitcoin dominance declines, it will allow altcoins, include LidoDAO price, to recover. In such a case, if LDO produces a three-day candlestick close above $2.62, it will invalidate the head-and-shoulders setup.
This development could see Lido DAO (LDO) price rally 26% and tag the head’s peak at $3.33.
Author

Akash Girimath
FXStreet
Akash Girimath is a Mechanical Engineer interested in the chaos of the financial markets. Trying to make sense of this convoluted yet fascinating space, he switched his engineering job to become a crypto reporter and analyst.


