Jupiter eyes for a rally as perpetual trading volume reaches new ATH
- Jupiter's price recovers after retesting the support zone between $0.637 and $0.708.
- Artemis data shows that JUP's perpetual trading volume reaches a new ATH of $1.7 billion.
- A daily candlestick close below $0.637 would invalidate the bullish thesis.

Jupiter's (JUP) price retested the support area between $0.637 and $0.708 on Monday and surged 12.5% over the next two days, trading at $0.878 on Thursday, 10% above its opening price. Additionally, Artemis data indicates that JUP's perpetual trading volume has reached a new all-time high of $1.7 billion, suggesting a bullish move on the horizon.
Jupiter price poised for a rally following retest of support zone
Jupiter price retested the support area that extends from $0.637 to $0.708 on Monday and bounced 12.5% over the following two days. As of Thursday, it trades at $0.878, 10% higher on the day.
If this support level holds, JUP could rally 15.5% from its current trading level of $0.878 to retest a weekly resistance at $1.005.
The Relative Strength Index (RSI) on the daily chart has rebounded from the oversold threshold of 30, while the Awesome Oscillator (AO) remains below the neutral zero level. If bulls are indeed making a comeback, both momentum indicators must maintain their positions above their respective mean levels of 50 and zero. This would add a tailwind to the recovery rally.
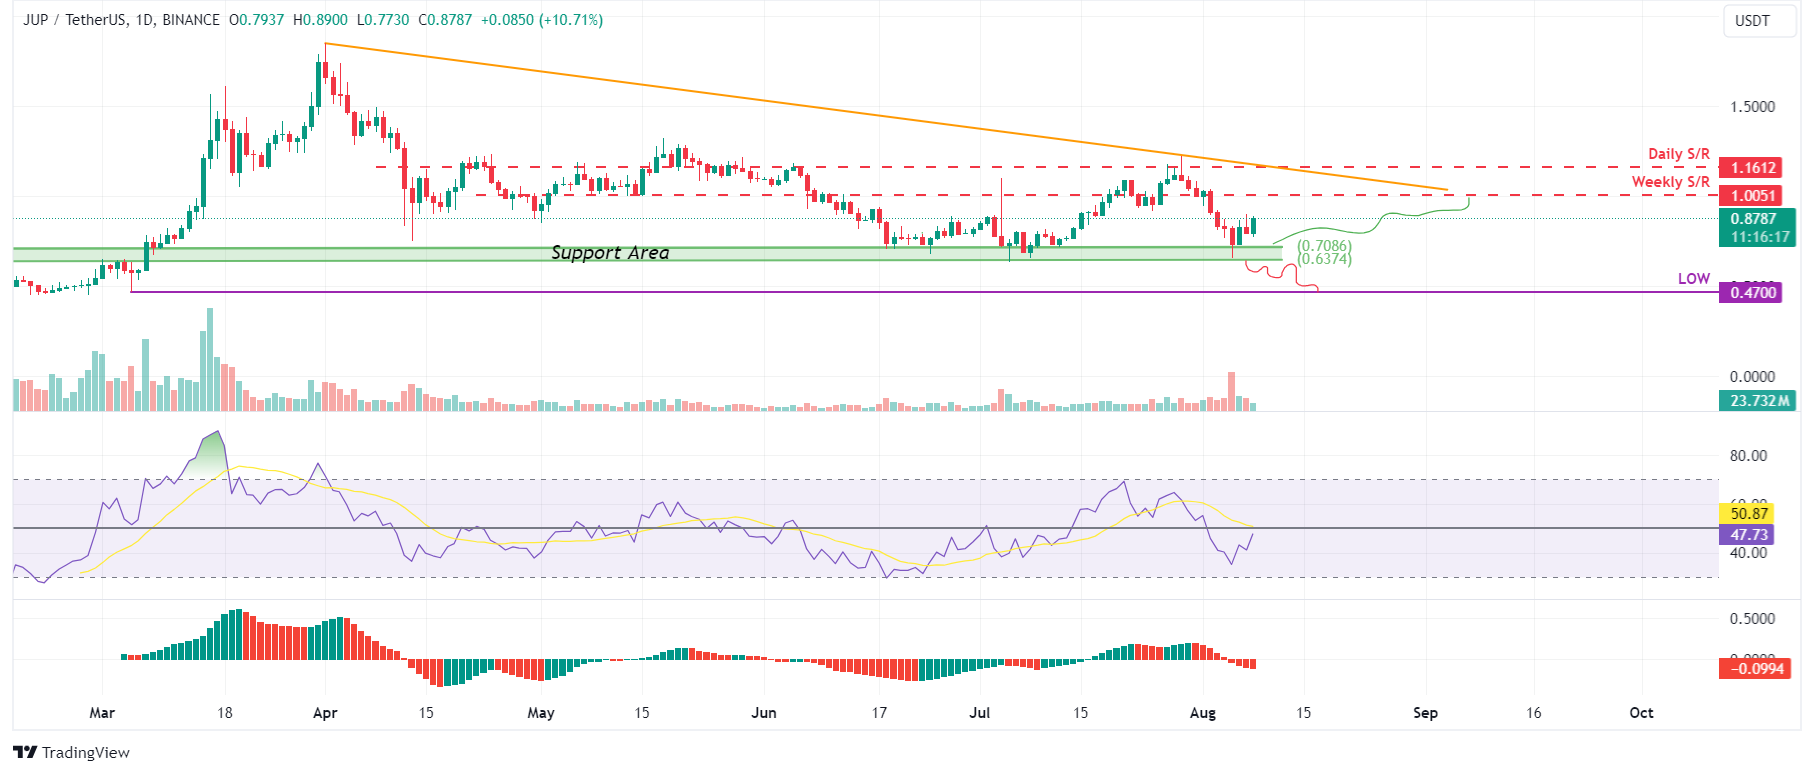
JUP/USDT daily chart
Meanwhile, Artemis Terminal data shows that Jupiter's perpetual trading volume hit a new all-time high of $1.7 billion on Monday, indicating heightened interest and engagement from traders and increased liquidity.
Additionally, the total fee collected by the Jupiter trading terminal reached $2.5 million on Monday, setting a new all-time high and indicating higher trading volumes, increased revenue generation, and growing market confidence, further enhancing Jupiter's bullish credentials.
-638587225295018592.jpg)
Jupiter Perpetual Trading Volume chart
-638587225603509927.jpg)
Jupiter Fees chart
Despite Jupiter reaching new all-time highs in trading volume and fee collection, along with bullish technical analysis, a daily candlestick close below the $0.637 support area would invalidate the bullish thesis by creating a lower low on the daily timeframe. This scenario could lead to a potential 27% crash in JUP's price to retest its March 5 daily low of $0.470.
Author

Manish Chhetri
FXStreet
Manish Chhetri is a crypto specialist with over four years of experience in the cryptocurrency industry.


