- Jito price action shows a potential cup and handle formation.
- Based on theoretical measurement rules, a successful breakout could yield a 56% rally to $6.0.
- A breakdown of the $3.86 support level would create a lower low for JTO and invalidate the bullish thesis.
Jito (JTO) price has been on an uptrend since forming a local bottom in early January. Since then, JTO has revisited the key swing point formed in early December, suggesting the bulls’ intention to move higher.
Jito price coils up for an explosive move
Jito price has produced a rounded bottom between December 9, 2023, and March 16, 2024. But the retracement that began after mid-March, hints that this rounded bottom could transform into a bullish pattern termed – cup and handle.
This technical formation contains a rounded bottom called a ‘cup’ followed by a ‘handle’. The handle is a brief, downward trend to the right of the cup's peak. It typically doesn't fall below the bottom of the cup. A trend line drawn connecting the cup and the handle’s peaks is key for tracking a breakout.
A decisive close above this resistance level forecasts a 56% upswing to $6.0 obtained by measuring the distance between the cup’s peak to the right side and the bottom of the cup and adding it to the breakout point at $3.86.
This move will be interesting to watch, considering it will overcome the $4 and the $5 psychological levels to tag the next one at $6.
Also read: SBF sentenced to 25 years in prison after November conviction
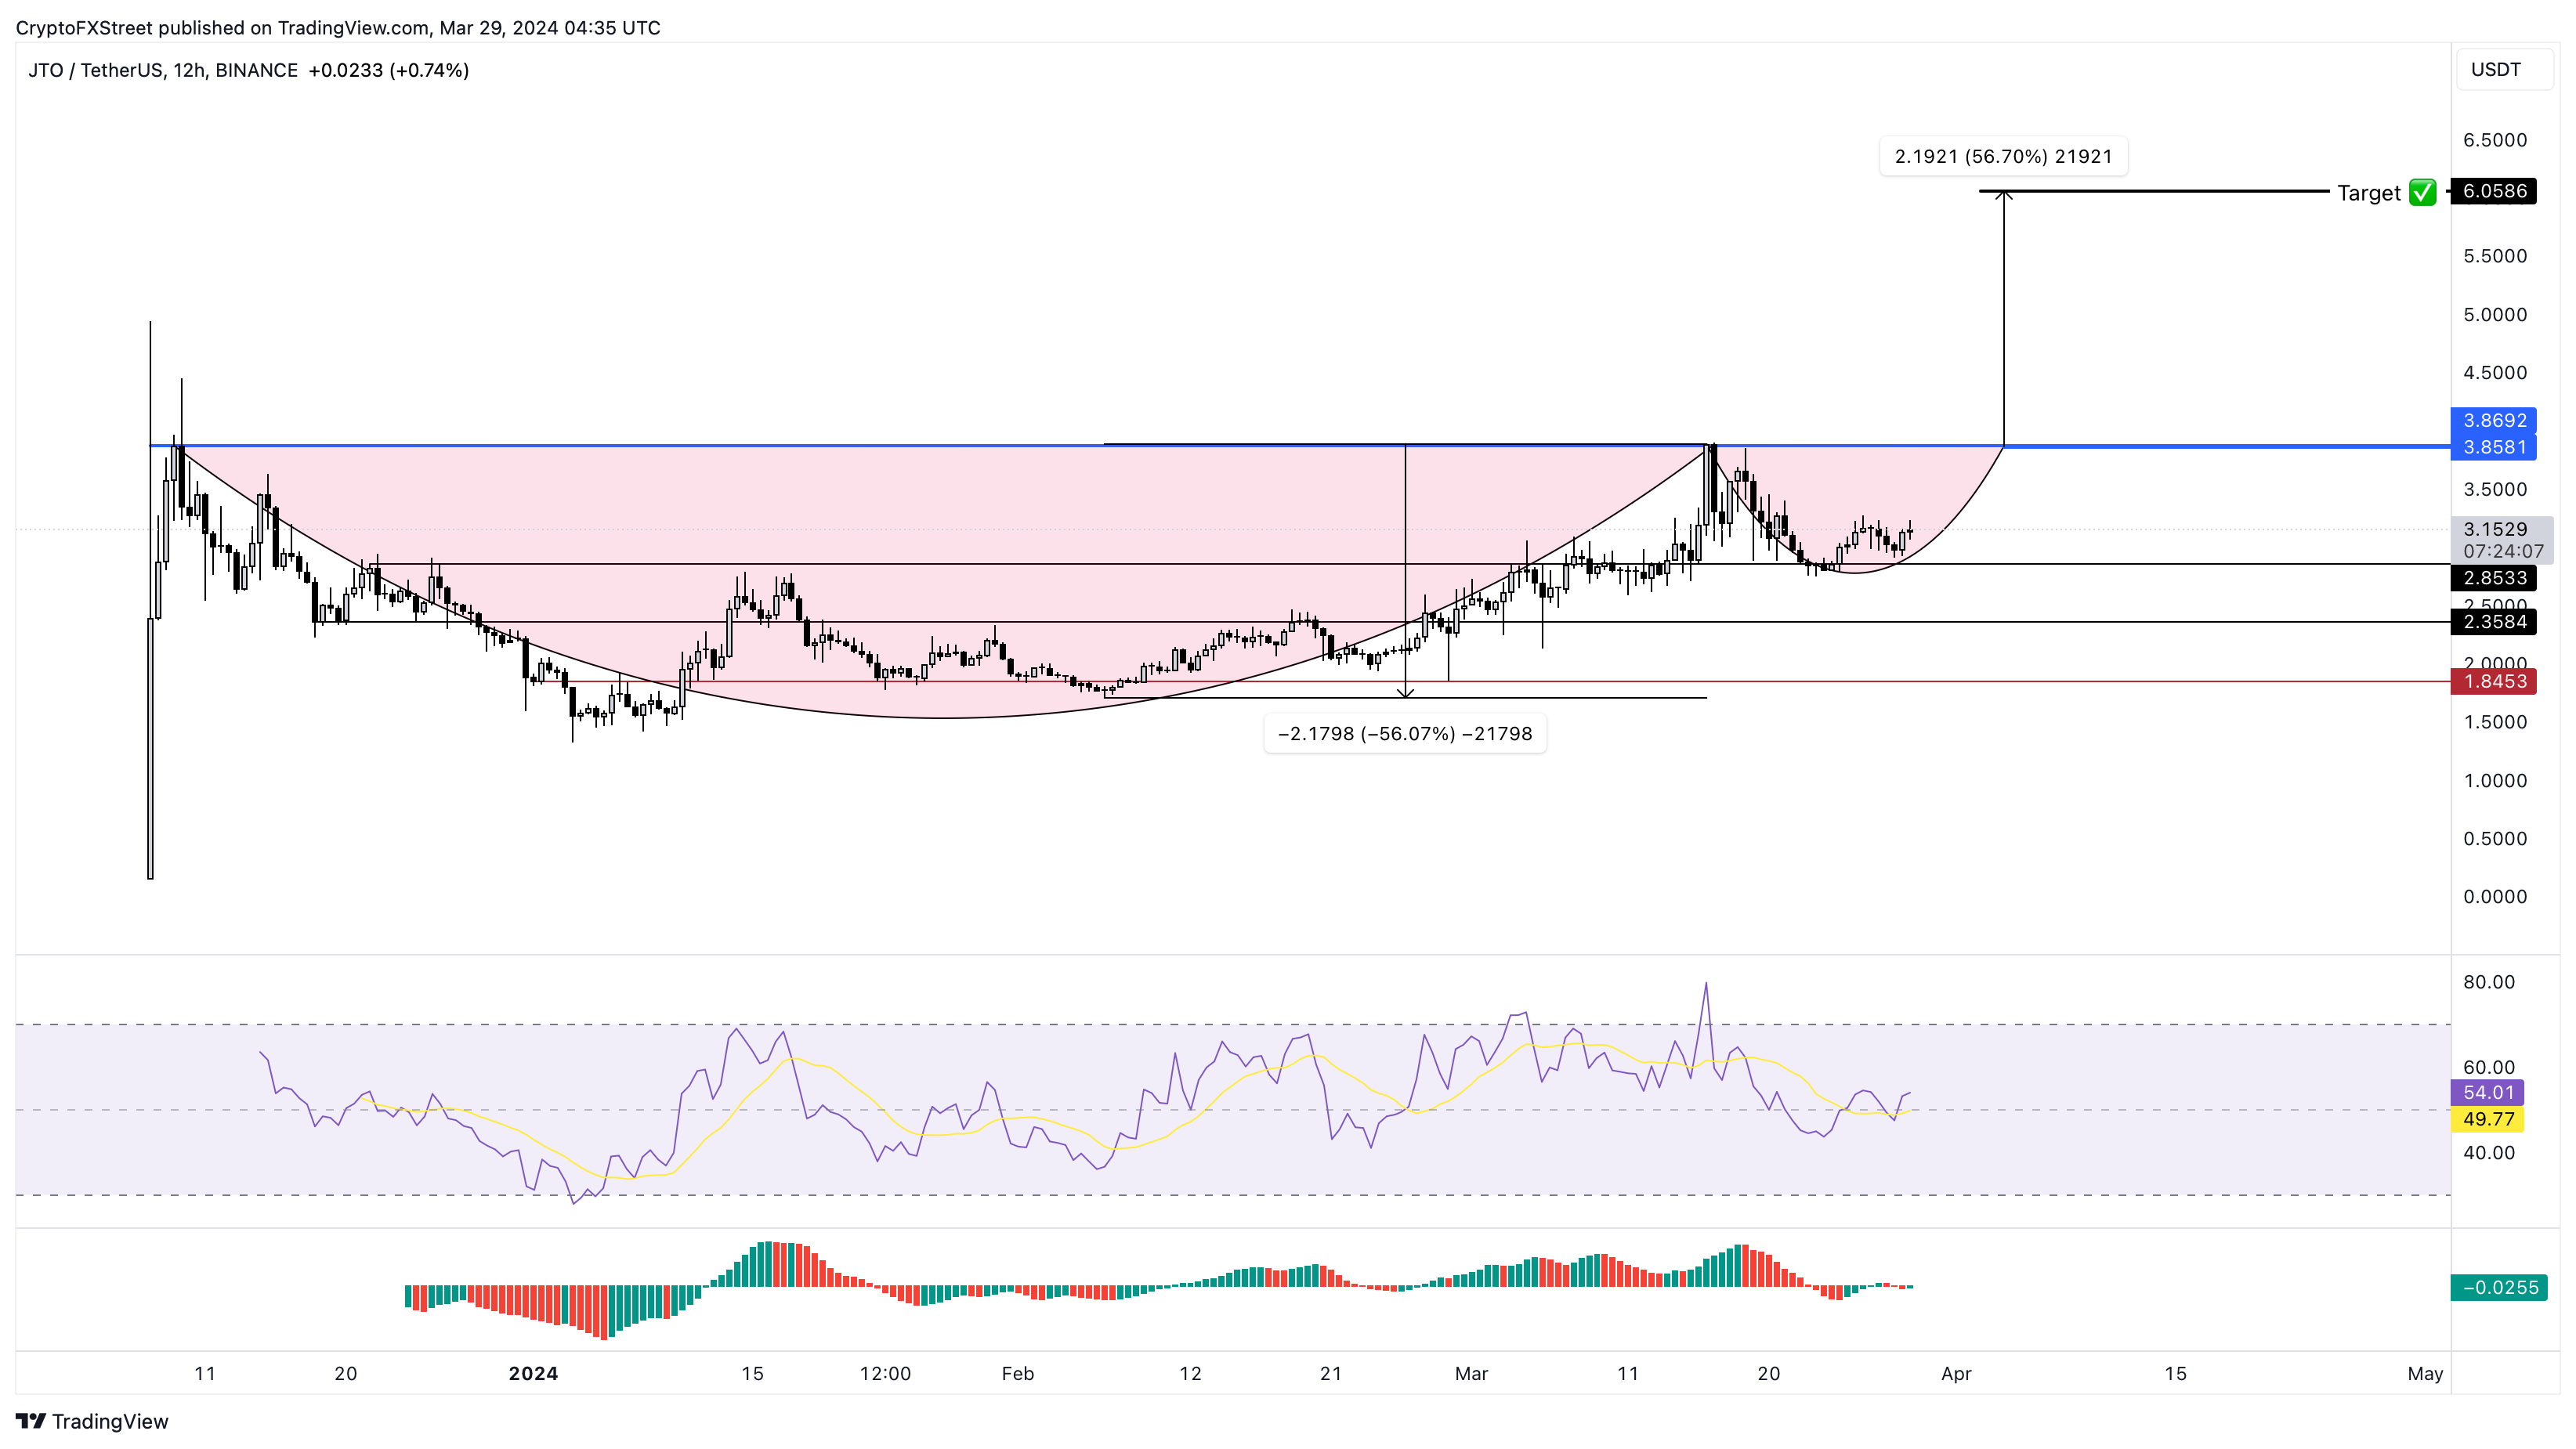
JTO/USDT 12-hour chart
While the outlook for the Jito price looks logical, the confirmation for the cup and handle setup is not here. The cup part of the pattern is yet to form. Beyond that, JTO needs to flip the breakout level at $3.86 to provide confirmation.
If Bitcoin price triggers a correction, Jito price could slide lower. In such a case, if JTO produces a twelve-hour candlestick close below the $2.85 support level, it would create a lower low and invalidate the bullish thesis. This development could lead to a 17% crash to the next key support level at $2.85.
Information on these pages contains forward-looking statements that involve risks and uncertainties. Markets and instruments profiled on this page are for informational purposes only and should not in any way come across as a recommendation to buy or sell in these assets. You should do your own thorough research before making any investment decisions. FXStreet does not in any way guarantee that this information is free from mistakes, errors, or material misstatements. It also does not guarantee that this information is of a timely nature. Investing in Open Markets involves a great deal of risk, including the loss of all or a portion of your investment, as well as emotional distress. All risks, losses and costs associated with investing, including total loss of principal, are your responsibility. The views and opinions expressed in this article are those of the authors and do not necessarily reflect the official policy or position of FXStreet nor its advertisers. The author will not be held responsible for information that is found at the end of links posted on this page.
If not otherwise explicitly mentioned in the body of the article, at the time of writing, the author has no position in any stock mentioned in this article and no business relationship with any company mentioned. The author has not received compensation for writing this article, other than from FXStreet.
FXStreet and the author do not provide personalized recommendations. The author makes no representations as to the accuracy, completeness, or suitability of this information. FXStreet and the author will not be liable for any errors, omissions or any losses, injuries or damages arising from this information and its display or use. Errors and omissions excepted.
The author and FXStreet are not registered investment advisors and nothing in this article is intended to be investment advice.
Recommended Content
Editors’ Picks
Chainlink social dominance hits six-month peak as LINK extends gains
-637336005550289133_XtraSmall.jpg)
Chainlink social dominance surged to a six-month peak on Friday as LINK holders increased their activity. LINK traders started taking profits, on-chain data trackers show. LINK price added 6% on Friday, extending its gains from mid-week.
Binance helps Taiwan crack a virtual asset money laundering case, BNB sustains above $570

Binance’s Financial Crimes Compliance (FCC) department joined forces with Taiwan’s Ministry of Justice and helped resolve a case of money laundering worth NT$200 million, or $6.2 million.
Bitcoin Weekly Forecast: Is BTC out of the woods? Premium

Bitcoin price shows signs of continuing its uptrend, providing a buying opportunity between $64,580 to $63,095. On-chain metrics forecast a bullish outlook for BTC ahead. If BTC clears $70,000, the chances of resuming the uptrend would skyrocket.
XRP trades steady at $0.50 as Ripple shares plan to expand services in Africa

Ripple hovers close to $0.51 on Friday, above the psychologically important $0.50 level, as traders await the court ruling of the lawsuit against the US Securities and Exchange Commission and amid new commitments from the firm to expand its services in Africa.
Bitcoin: Is BTC out of the woods? Premium
Bitcoin (BTC) price action in the past two days has confirmed the resumption of the bull run. However, BTC needs to clear a few key hurdles before investors can go all-in.