Is this a buy-the-dip pullback before Shiba Inu price rallies 115%
- Shiba Inu price comes close to undoing the Robinhood listing’s 36% rally.
- The correction pushes SHIB into a $0.0000219 to $0.0000246 demand zone, hinting at a bullish impulse soon.
- A daily candlestick close below $0.0000211 will invalidate the bullish thesis for the meme coin.
Shiba Inu price accumulation or consolidation increases in intensity as it remains in a range for roughly two months. While the price action is boring, the recent downswing has pushed SHIB into a vital demand zone that is likely to trigger another run-up.
Also read: SOS Stock Price: Sos Ltd snaps losing streak despite hitting a new 52-week low price
Shiba Inu price at wits’ end
Shiba Inu price action from January 4 has resulted in an Adam and Eve pattern. However, the breakout seems to be veering off into the distance as SHIB sticks to its range, extending from $0.0000211 to $0.0000271, as it consolidates.
The lack of volatility in Bitcoin is further affecting the dog-themed crypto resulting in a massive sideways movement that began on February 24. The upper limit at $0.0000271 seems to be an extremely tough level to surpass. Every attempt to breach the said barrier since March 1 has resulted in a steep correction.
The Robinhood listing on April 12 led to a 36% rally on a daily time frame, but since then, Shiba Inu price has dropped 22% and is currently hovering inside a demand zone, ranging from $0.0000219 to $0.0000246.
A bounce off this barrier is likely to lead to a retest of the bottom reversal pattern’s neckline at $0.0000329. Coming back to the Adam and Eve, this setup contains a V-shaped valley followed by a rounding bottom.
The technical formation forecasts a 38% upswing to $0.0000454, determined by measuring the valley’s depth and adding it to the breakout point at $0.0000329.
Only a daily candlestick close above the said barrier will indicate a breakout and kick-start a move to the target at $0.0000454. In some cases, this uptrend might extend to retest the $0.0000500 psychological level, which would bring the total run-up to 115% in gain.
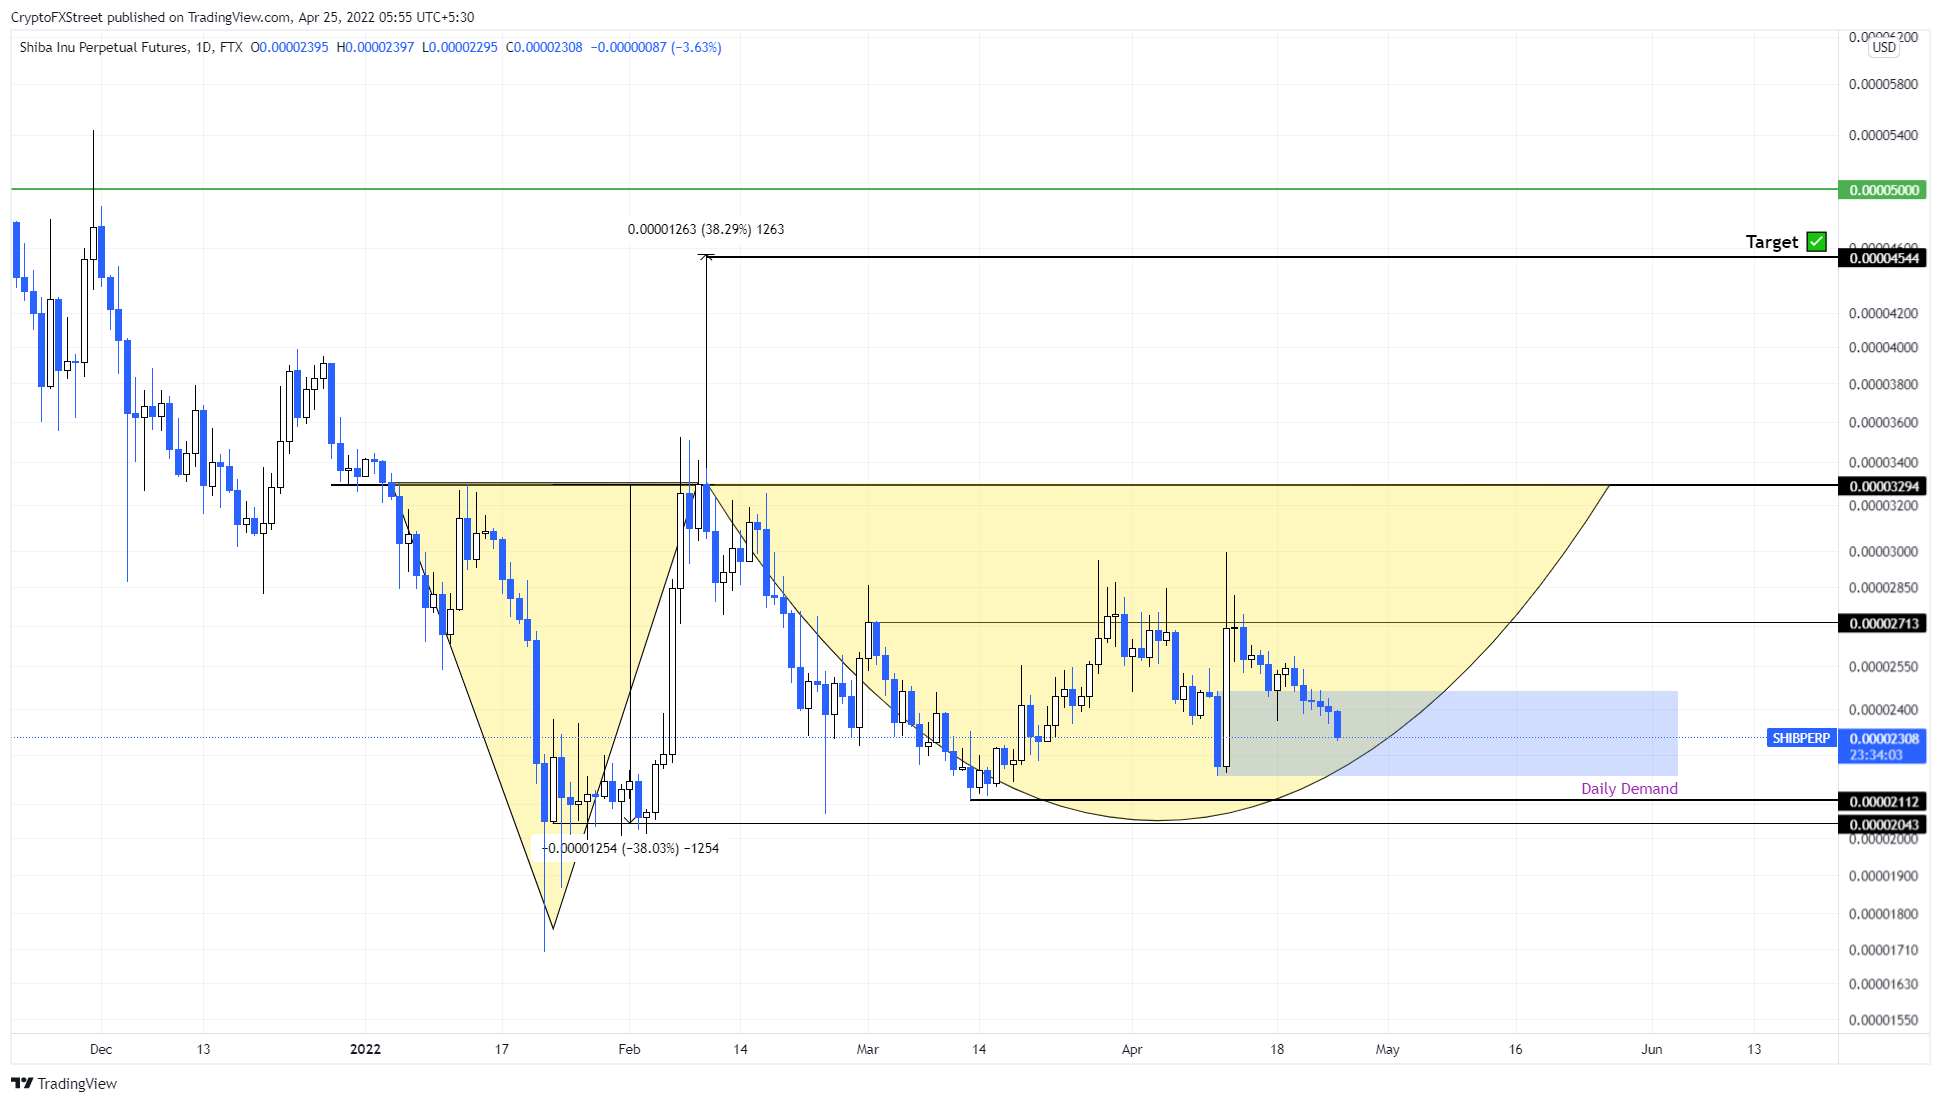
SHIB/USDT 1-day chart
While things are looking optimistic for the meme coin, the big crypto’s downfall could easily put an end to this outlook. On a similar note, a daily candlestick close below $0.0000211 will create a lower low and invalidate the bullish thesis for Shiba Inu price.
In this situation. SHIB might crash to retest the stable support level at $0.0000204.
Author

Akash Girimath
FXStreet
Akash Girimath is a Mechanical Engineer interested in the chaos of the financial markets. Trying to make sense of this convoluted yet fascinating space, he switched his engineering job to become a crypto reporter and analyst.


