Shiba Inu price trading around technical anchor before 45% pop
- Shiba Inu price trades around the 55-day SMA at $0.00002425.
- SHIB price sees consolidation underway for this week.
- SHIB price set to explode to the upside as key-event this weekend gets defused.

Shiba Inu (SHIB) price is trading as a pendulum with the 55-day Simple Moving Average (SMA) as the anchor point in a week that only saw around 8% price variation against 27%. With that substantial drop in price action and the fact that the 55-day SMA is being used as an anchor point, a consolidation looks to be in effect. Expect a bullish pop next week, with markets set to jump on risk-on trades once Macron gets confirmed for another term as French president.
SHIB price sees bulls awaiting key risk event to unfold on Sunday
Shiba Inu price was trading relatively muted against the backdrop of the week before. With a narrow trading range of roughly 8%, the week before offered more than three times as much variation, with a 27% swing from high to low during the trading week. The fact that buyers and sellers are getting that close shows that the distribution phase is almost over, and a breakout trade will happen.
SHIB price is thus looking in a good mood and fit for another rally as markets are holding their breath over the weekend with elections in the second-largest economy of Europe. In the latest polls, the current ruling president will remain in his seat; thus, expect in the ASIA PAC on early Monday morning a jump in euro, a drop in dollar and with that tailwind of the weaker dollar, a lift in cryptocurrencies. SHIB price could rally at the beginning of next week above $0.00002640 and from there rally throughout the week towards $0.00003535 as FED officials are in a blackout period and traders can briefly forget about central bank issues and rate hikes.
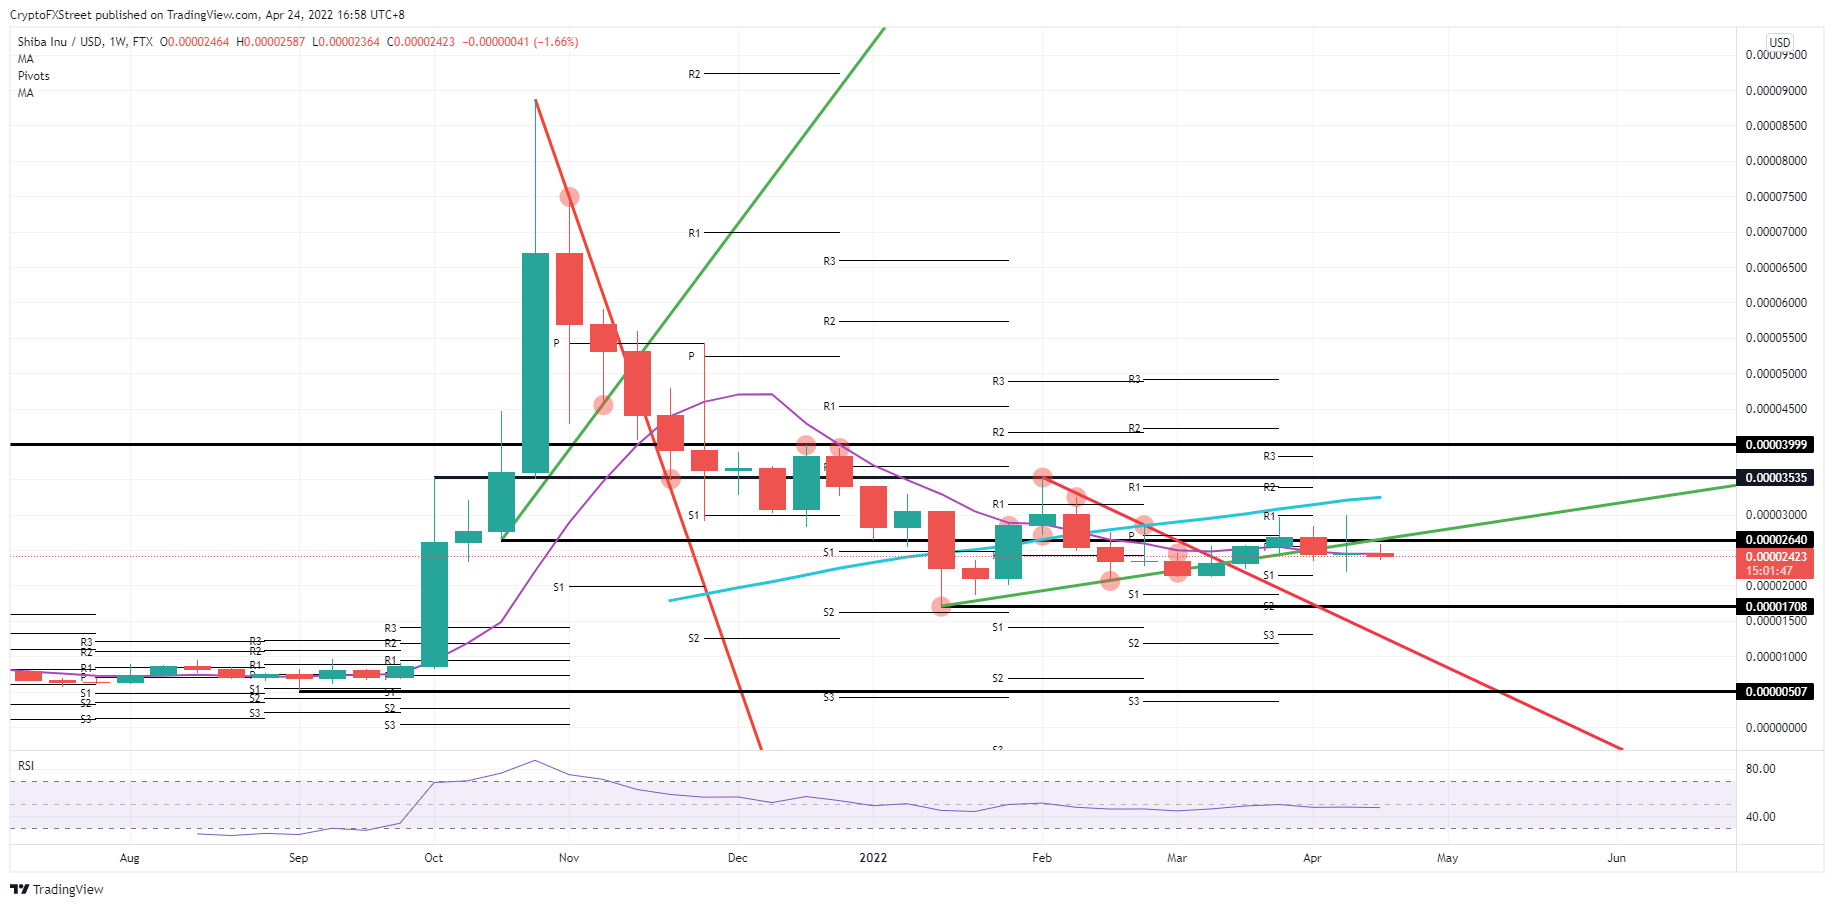
SHIB/USD weekly chart
The consolidation could still fall to the downside in a pure technical play as the bulls could get a rejection at the $0.00002640 level, opening up room for bears to fill the gap and push price action back to the low of last week near $0.00002100. The mood could be set for a total drop back to $0.00001708. That would mean a decline of almost 30% with headwinds emerging and more dollar strength in the markets.
Author

Filip Lagaart
FXStreet
Filip Lagaart is a former sales/trader with over 15 years of financial markets expertise under its belt.



