|

Is there any correction expected for SHIB?

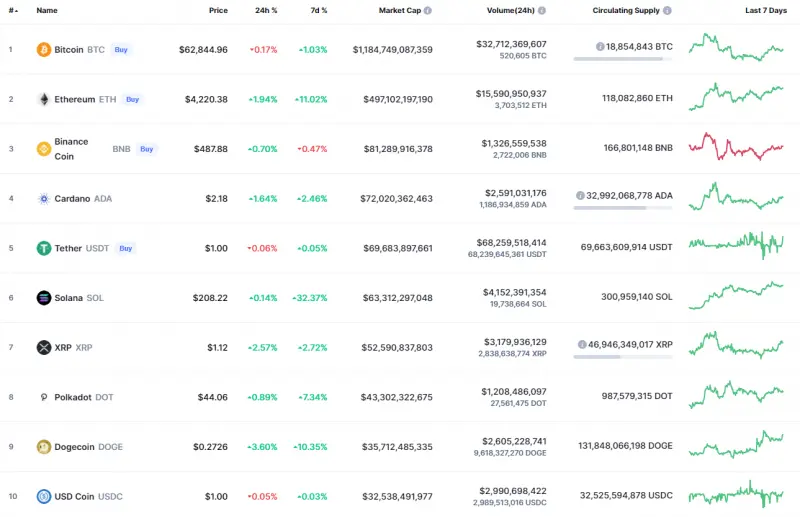
The majority of the coins remain in the green zone except for Bitcoin (BTC), whose rate has declined by 0.17% over the past 24 hours.
Chart

Top coins by CoinMarketCap

SHIB/USD

SHIB keeps setting new peaks, rocketing by 17.38% since yesterday.
Chart

SHIB/USD chart by TradingView

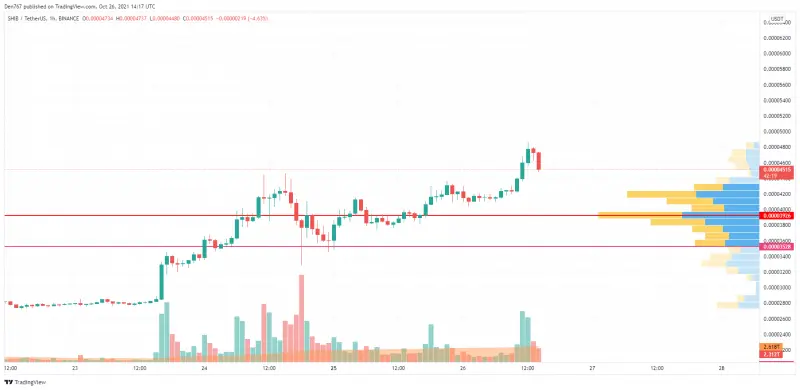
On the hourly chart, SHIB made a false breakout of the 4,800 satoshi mark supported by the increasing trading volume.

In terms of the nearest price action, the decline may continue to the liquidity zone at 4,000 satoshis, where bulls may again seize the initiative.
Chart

SHIB/USD chart by TradingView

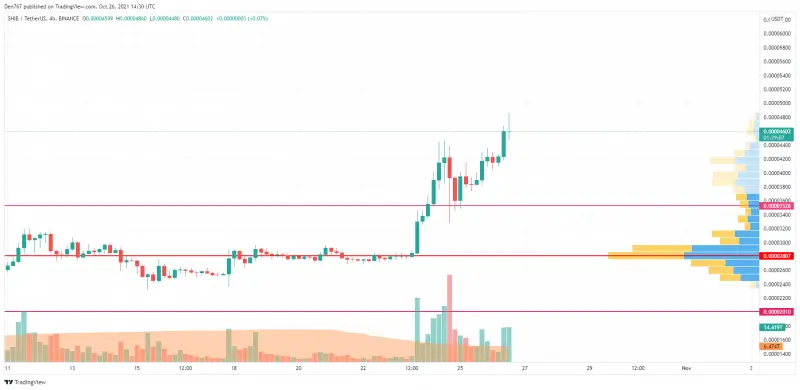
On the 4H chart, the drop may continue as buyers have no power to keep the rise going. In this case, the correction may last until SHIB makes a retest of the support at 3,528 satoshis. Such a scenario is valid until the end of the current week.
Chart

SHIB/USD chart by TradingView

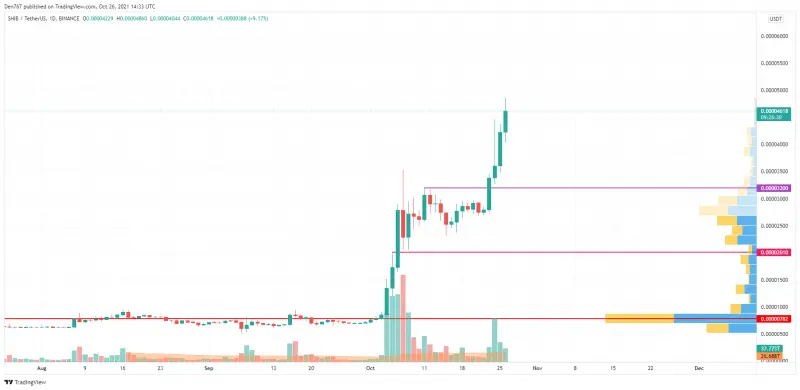
SHIB has been rising for the last five days, which confirms the current bullish trend. However, SHIB is overbought to a certain extent, which means that bulls can face a short-term correction to get more energy for continued growth.

The fall may bring SHIB to the nearest support at 3,200 satoshis shortly.

SHIB is trading at 4,625 satoshis at press time.


Read full original article on U.Today

Author

Denys Serhiichuk

With more than 5 years of trading, Denys has a deep knowledge of both technical and fundamental market analysis.

More from Denys Serhiichuk
Share:

Editor's Picks

Bitcoin Weekly Forecast: BTC retreats as macro headwinds grow
Bitcoin (BTC) remains under pressure, down over 4% this week and trading around $76,900 at the time of writing on Friday. Institutional demand shows signs of weakness as spot BTC Exchange Traded Funds (ETFs) are on track to end their three-week inflow streak, recording nearly $500 million in net outflows through Thursday.
XRP falls toward key support as macro uncertainty, weak momentum cap recovery
Ripple (XRP) falls below $1.33 on Friday, marking the third consecutive day of declines. The token continues to track the broader cryptocurrency market downturn, with investors closely monitoring heightened macroeconomic uncertainty ahead of the United States (US) Consumer Price Index (CPI) release and next week’s Federal Reserve (Fed) monetary policy decision.
Crypto Today: Bitcoin, Ethereum, XRP stabilize at lower levels amid ETF outflows and macroeconomic risks
The broader cryptocurrency market is rising on Friday, with Bitcoin (BTC) trading above $77,000 after testing lower support near $76,500. Ethereum (ETH) shows signs of stability, hovering above the support provided at $2,400 despite capped upside at $2,500. Meanwhile, Ripple (XRP) holds above $1.33 after three straight days of declines, reflecting growing headwinds due to macroeconomic uncertainty.
Bitcoin pulls back as another golden cross fails to deliver
Earlier this week, Bitcoin formed a golden cross, a technical signal that occurs when the price’s 50-day moving average rises above the 200-day moving average and is conventionally viewed as a precursor to a bullish rally. Historically, however, that’s often not been the case.
Bitcoin: BTC retreats as macro headwinds grow
Bitcoin (BTC) remains under pressure, down over 4% this week and trading around $76,900 at the time of writing on Friday. Institutional demand shows signs of weakness as spot BTC Exchange Traded Funds (ETFs) are on track to end their three-week inflow streak, recording nearly $500 million in net outflows through Thursday.

