- Tezos price is facing the 100-day EMA hurdle at $1.94, but clearing this blockade could result in handsome gains.
- Investors can expect XTZ to retest the ascending triangle forecast at $2.16 and subsequently the 200-day EMA at $2.52.
- A breakdown of the $1.67 support level will invalidate the bullish thesis.
Tezos price shows a steady grind toward its forecasted target. This development comes after a successful breakout from a bullish pattern. Investors can decide if they should hop on this train or stay away by looking at how XTZ reacts to an upcoming resistance level.
Tezos price faces a decisive moment
Tezos price produced four higher lows and three equal highs at $1.67 since June 18. Connecting these swing points using trend lines shows an ascending triangle formation that forecasts a 29% upswing to $2.16.
The target is determined by adding the distance between the first swing high and swing low to the breakout point at $1.66. On July 18, the altcoin seemed to break out, but it was a fake move. However, on July 28, the buyers stepped up and produced a successful breakout.
Since then, Tezos price has rallied 14% to where it currently faces the 100-day Exponential Moving Average (EMA) at $1.94. If bulls manage to move above this level and flip it into a support floor, investors can hop in this up-only train for XTZ and ride it till the forecasted target at $2.16 or the next hurdle at $2.52, aka the 200-day EMA.
This move would constitute a 32% ascent from the current position.
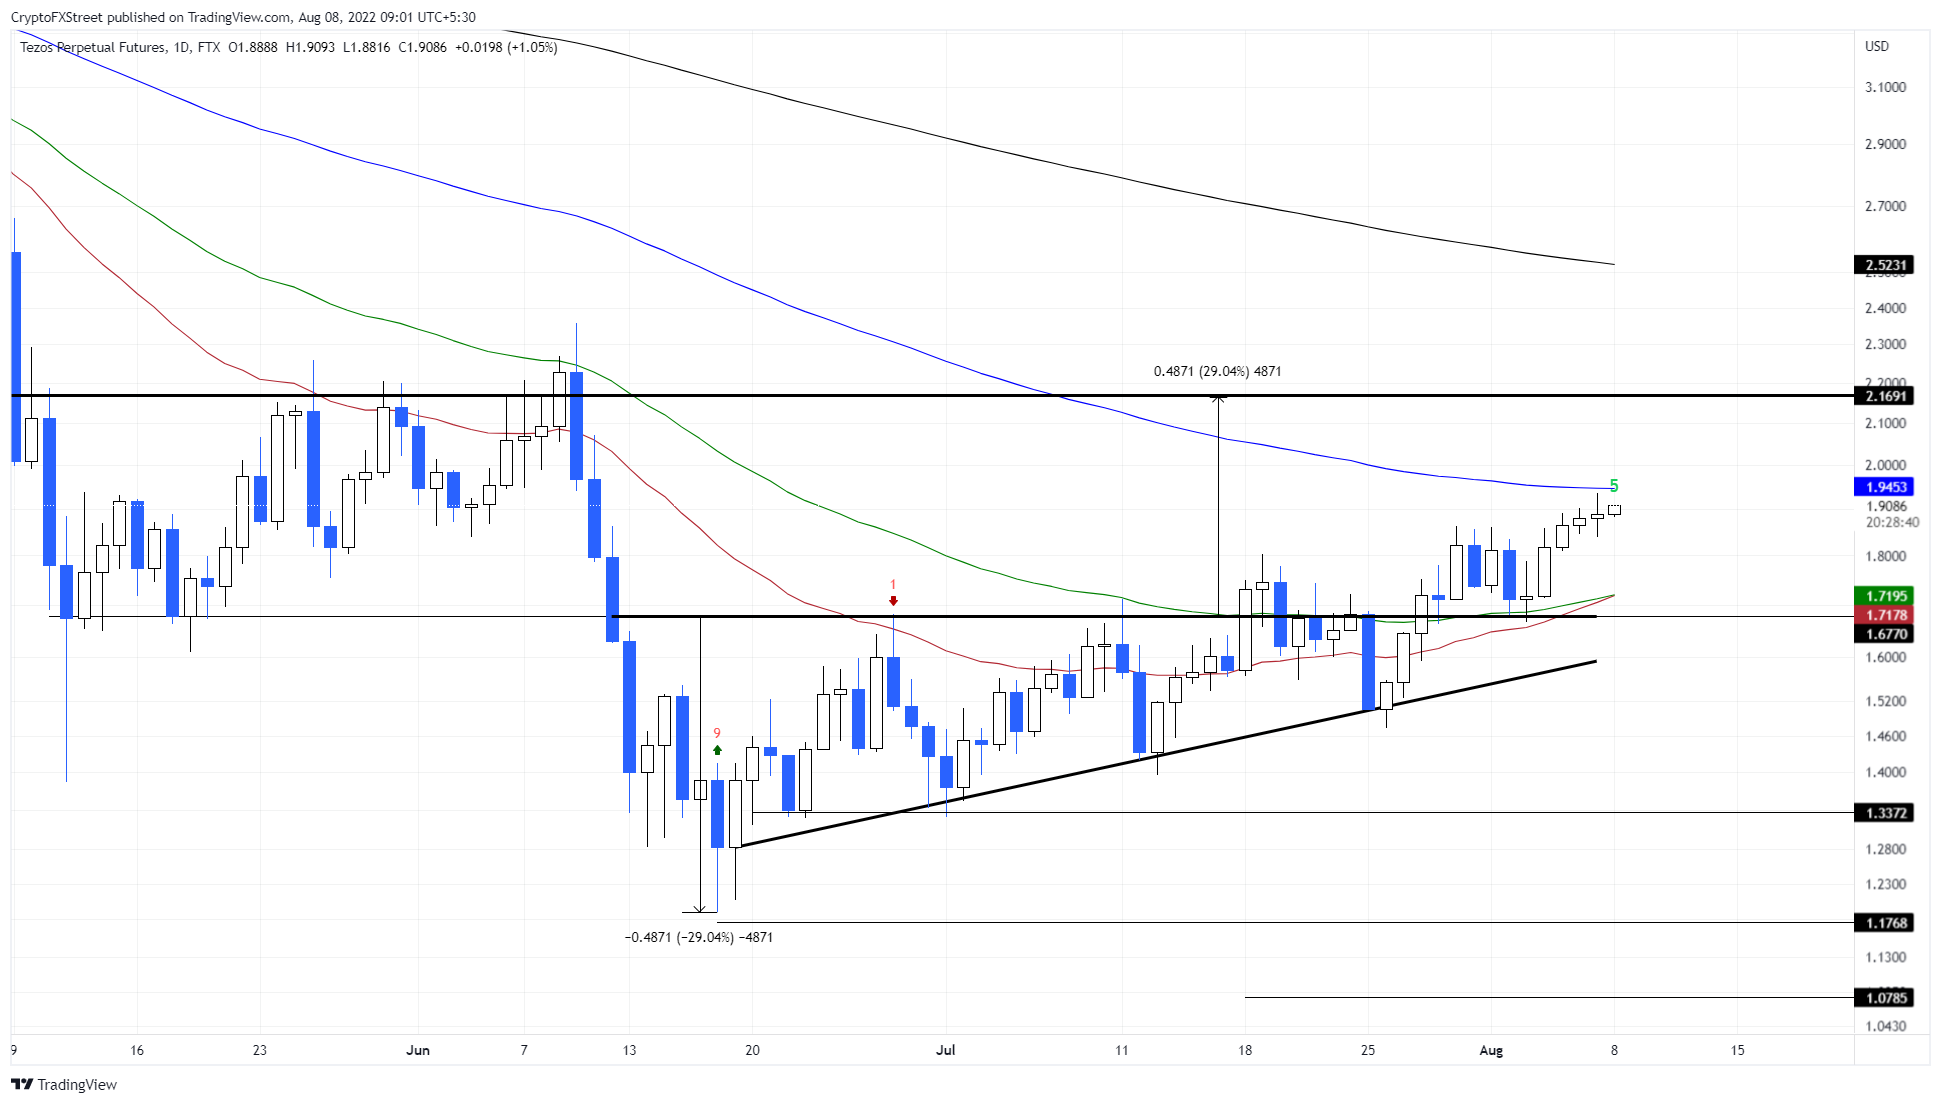
XTZ/USDT 1-day chart
On the other hand, if Tezos price fails to move past the 100-day EMA at $1.94, it is likely to pull back to $1.72, where the 30- and 50-day EMAs coincide. In such a case, investors have another opportunity to buy XTZ at a discount.
However, a daily candlestick close below this support confluence at $1.72 and the $1.67 support level will invalidate the bullish thesis for Tezos price. In this case, a bearish breakout could knock the altcoin down to $1.33.
Information on these pages contains forward-looking statements that involve risks and uncertainties. Markets and instruments profiled on this page are for informational purposes only and should not in any way come across as a recommendation to buy or sell in these assets. You should do your own thorough research before making any investment decisions. FXStreet does not in any way guarantee that this information is free from mistakes, errors, or material misstatements. It also does not guarantee that this information is of a timely nature. Investing in Open Markets involves a great deal of risk, including the loss of all or a portion of your investment, as well as emotional distress. All risks, losses and costs associated with investing, including total loss of principal, are your responsibility. The views and opinions expressed in this article are those of the authors and do not necessarily reflect the official policy or position of FXStreet nor its advertisers. The author will not be held responsible for information that is found at the end of links posted on this page.
If not otherwise explicitly mentioned in the body of the article, at the time of writing, the author has no position in any stock mentioned in this article and no business relationship with any company mentioned. The author has not received compensation for writing this article, other than from FXStreet.
FXStreet and the author do not provide personalized recommendations. The author makes no representations as to the accuracy, completeness, or suitability of this information. FXStreet and the author will not be liable for any errors, omissions or any losses, injuries or damages arising from this information and its display or use. Errors and omissions excepted.
The author and FXStreet are not registered investment advisors and nothing in this article is intended to be investment advice.
Recommended Content
Editors’ Picks
Solana price nears $60 after 6% rise in a day as institutions pour millions into SOL

Solana price trading at $58 is presently attempting to breach through the resistance level marked at $59. A rally is possible, given that SOL is witnessing a resurgence in bullishness. Month to date, Solana has witnessed inflows worth $40.2 million.
THORChain price climbs 15% as native RUNE secures self-custody wallet integration

THORChain (RUNE) price is pumping hard, recording a 15% addition to its market value on the day, alongside a 50% rise in trading volume. When price and trading volume rise in tandem, it often points to the asset gaining attention and therefore interest among buyers.
Up by 96% in a week, this altcoin is likely following Solana price rally from 2021

Solana was known as the “Ethereum killer” when it skyrocketed back in 2021; however, it did not manage to kill the DeFi home in any way. Similarly, many altcoins have since emerged that have been denoted as Solana killers, but hardly anyone has managed to do that.
Chainlink price readies for 10% gains as LINK staking v0.2 priority migration goes live
-637336005550289133_XtraSmall.jpg)
Chainlink (LINK) v0.2 migration has gone live, with the upgrade introducing a staking platform that ensures stakers enjoy greater flexibility. It also delivers improved security guarantees, a modular architecture, and a dynamic rewards mechanism.
Three key BTC accumulation levels before ETF approval in January 2024

Bitcoin, from a high time-frame perspective, has been in an up-only trend since the start of 2023. BTC has ignored many sell signals due to the likelihood of an Exchange-Traded Fund approval. With the holidays around the corner, falling liquidity could see BTC discounted from its current level, hovering around the $37,000 region.