How whale activity fuels Bitcoin cycles: a 2017 vs. 2023 comparison
- Bitcoin price rally in 2017 was largely driven by the ICO craze kicked off by Ethereum and a focus on altcoins.
- While the 2023 YTD price increase is driven by institutions and large wallet investors, the 2017 cycle was largely supported by retail traders.
- Profit rotation from altcoins drove a Bitcoin price rally in 2017, while DeFi-related assets take the center stage in 2023.

Bitcoin (BTC) price cycles are structured around halving events that occur once roughly every four years, when rewards to miners are cut in half. The next BTC halving is expected in early 2024, and evaluating the differences between the 2015 to 2017 and 2020 to 2023 Bitcoin cycles can help traders define their expectations and prepare for the bull run.
Also read: Top 3 Price Prediction Bitcoin, Ethereum, Ripple: BTC to surprise investors with 10% sell-off
Comparing two Bitcoin price cycles and whale activity
Bitcoin’s massive price rally in its 2015 to 2017 cycle set a record. However, the 2020 to 2023 cycle, which sent BTC to an all-time high of $69,044, has different catalysts and players. Still, the two Bitcoin price cycles followed a similar trajectory: it started with a bullish catalyst that was followed by capital rotation into BTC and massive participation from key players in the ecosystem.
The two cycles, however, differed in terms of the role played by retail and institutional traders, as well as activity of large wallet investors, popularly known as whales, in the Bitcoin ecosystem.
The 2015 to 2017 Bitcoin price cycle is considered one of the most iconic ones and can be summarized as follows:
- Initial Coin Offering (ICO) spree initiated by Ethereum.
- Altcoins, shitcoins and everything in between.
- Capital rotation into Bitcoin.
Bitcoin price rally to $19,665 in mid-December 2017 was fueled by a massive participation of retail investors.
Bitcoin whales pushed BTC price to its 2017 cycle top
Based on data from crypto intelligence tracker Santiment, there was a consistent rise in the number of large wallet addresses holding more than 1,000 BTC. At the beginning of 2015, there were 13,903 addresses holding between 100 and 1,000 Bitcoin, 1,438 addresses containing between 1,000 and 10,000 BTC and 90 wallets holding between 10,000 to 100,000 Bitcoin.
All three segments of large wallet investors on Bitcoin witnessed a consistent increase from 2015 to the 2017 cycle top, after which there was a notable decline. Bitcoin price is represented by the green line.
%20[19.30.10,%2024%20May,%202023]-638205389910451491.png)
Bitcoin whale wallet address count through segments in the 2015 to 2017 cycle
As seen in the chart above, a large segment of retail traders accumulated BTC at a discount, before price started rallying in the second half of 2017.
The 2015 to 2017 Bitcoin cycle in a glimpse
In 2017, Bitcoin acted as a gateway for market participants to jump in on the Initial Coin Offering (ICO) craze, where traders exchanged BTC for altcoins and the popularly known shitcoins, currencies with little to no discernible purpose and low value. This fueled a massive spike in demand for Bitcoin and acted as a catalyst for its price rally.
The following chart from TradingView puts Bitcoin’s dominance into perspective and signals a massive decline after the 2017 bull run, at a moment when altcoins gained relevance and popularity. In the 2015 to 2017 cycle, capital rotated from altcoins to Bitcoin, giving the flagship cryptocurrency an edge over the others, but this changed at the cycle’s end.
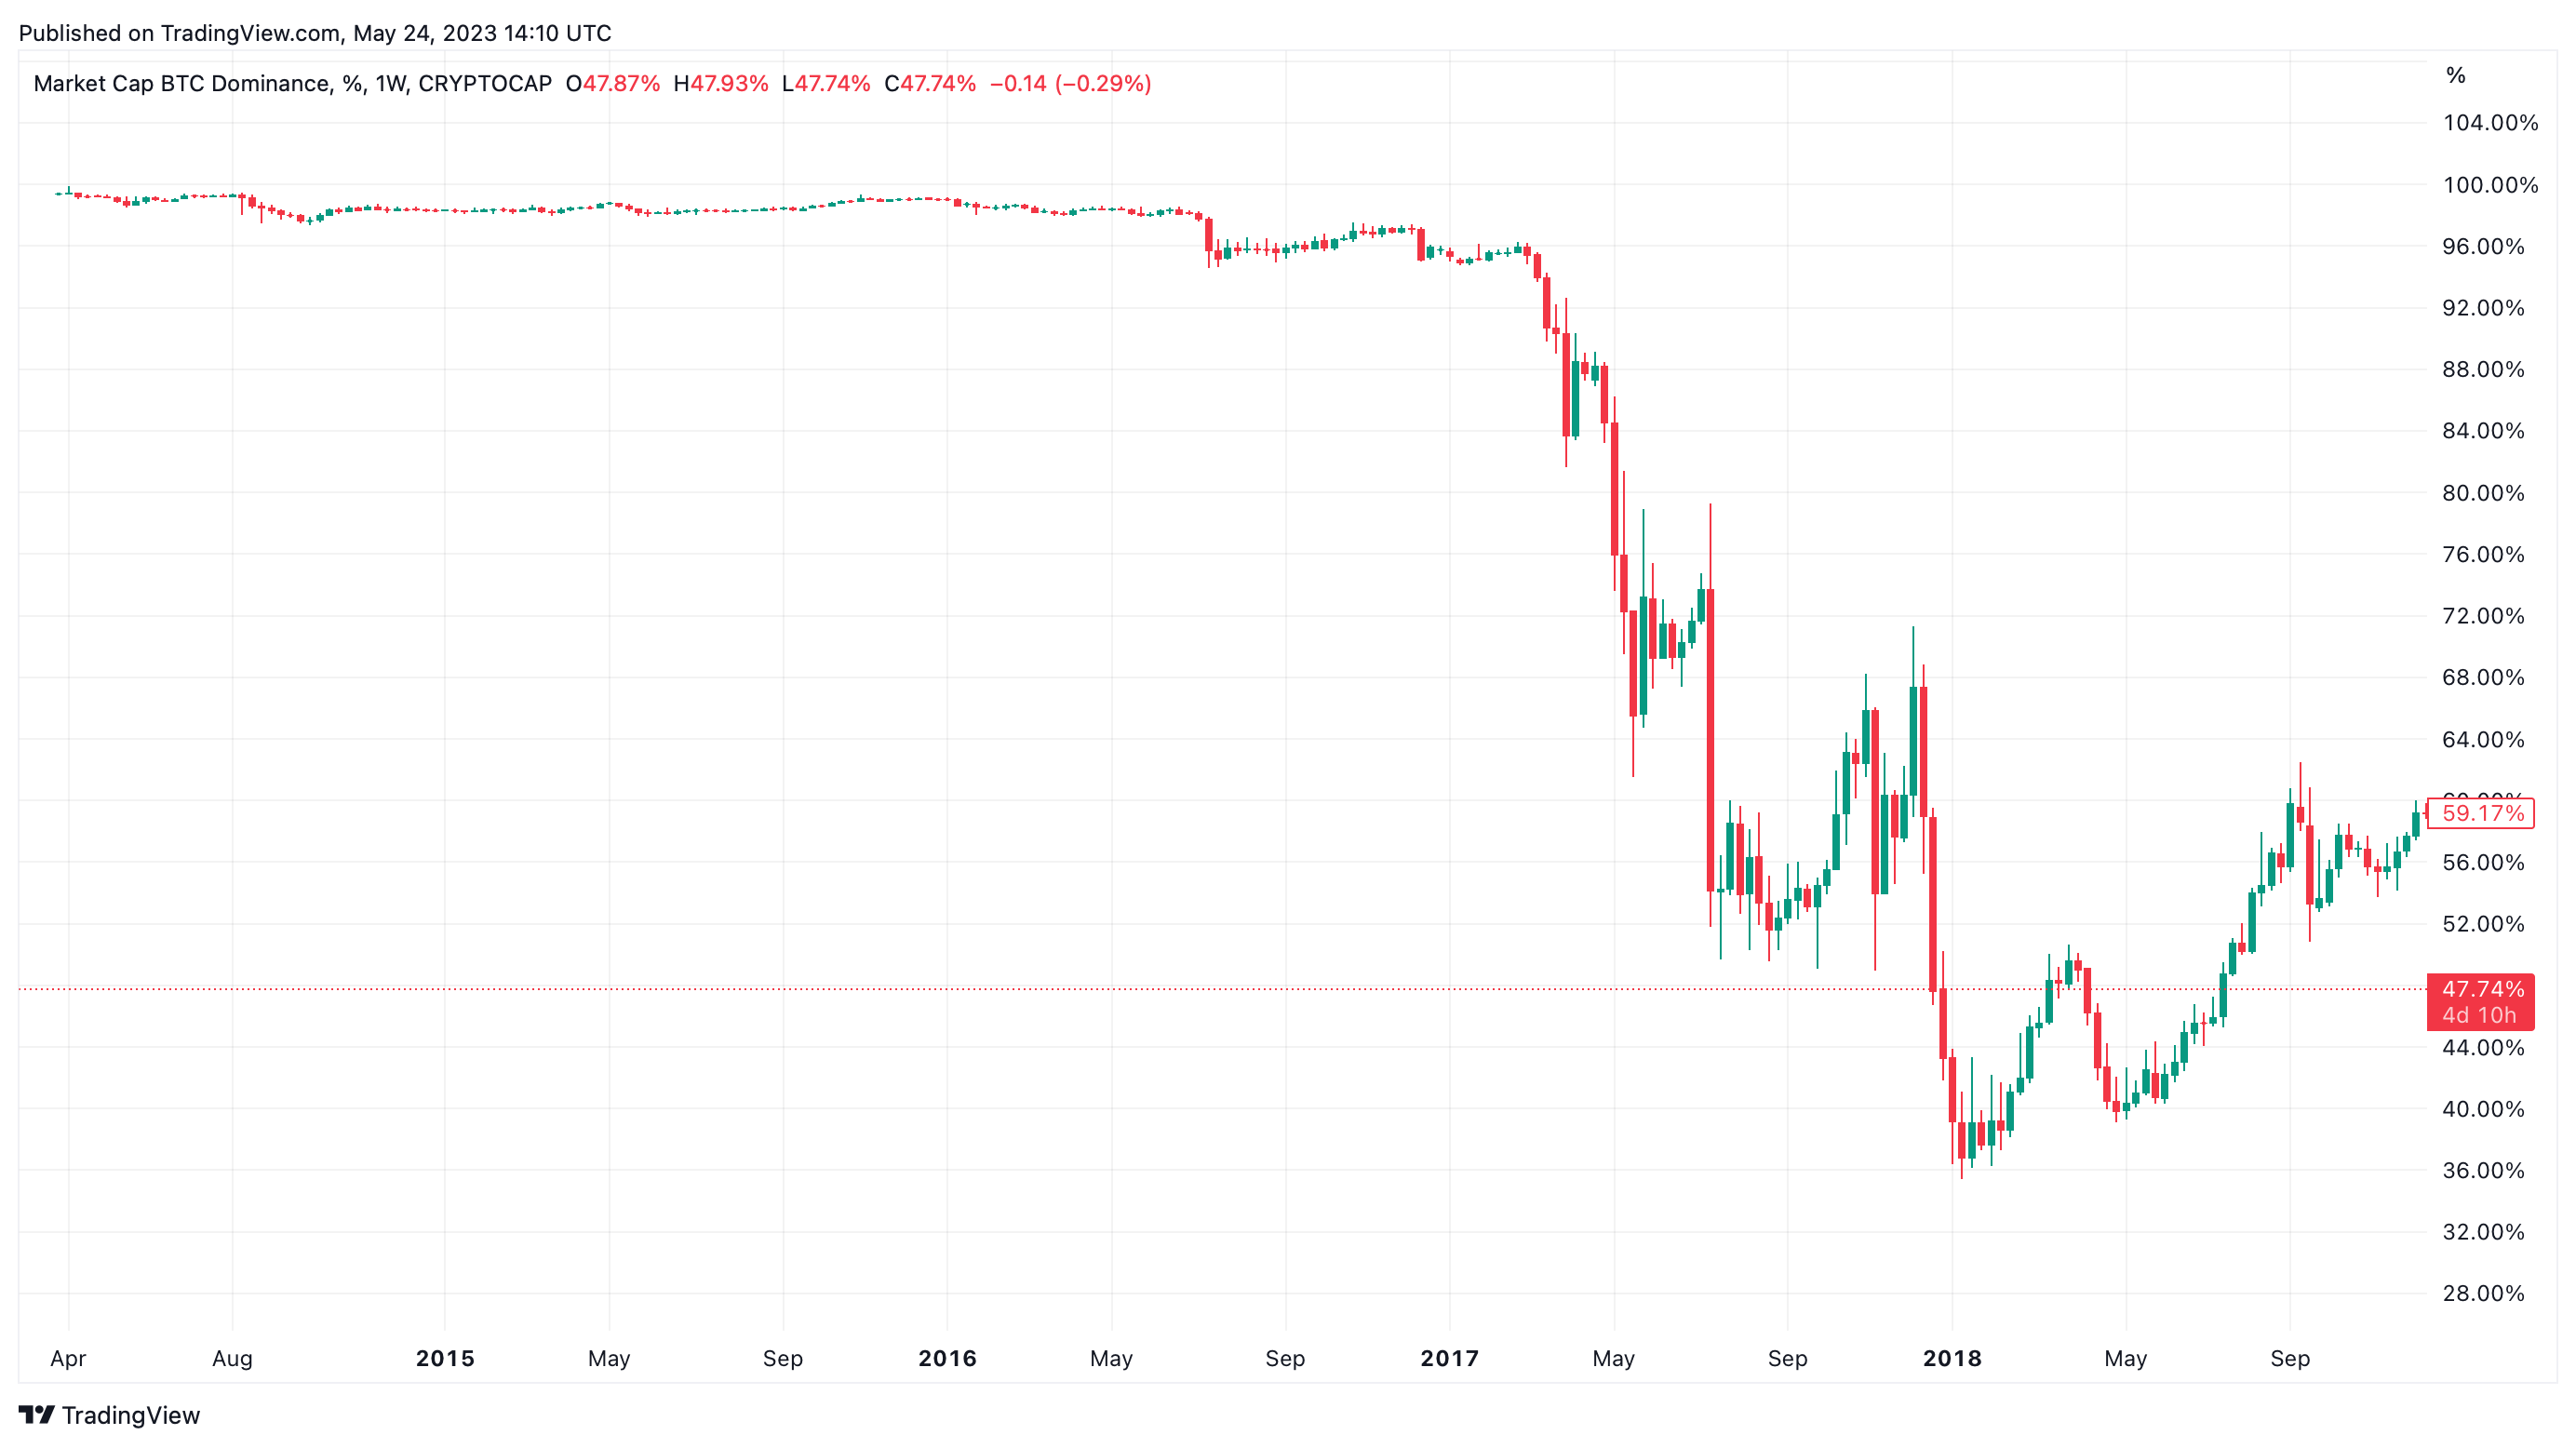
Market Capitalization Bitcoin dominance %
Bitcoin’s dominance fell from nearly 100% at the beginning of 2015 to just over 96% in 2017.
How the 2020 to 2023 Bitcoin cycle is different
The 2020 to 2023 BTC price cycle kicked off in a similar fashion as previous cycles. In this case, the bullish catalyst was Decentralized Finance, or DeFi, instead of the ICO craze. . DeFi emerged as the biggest highlight of 2020, going from $700 million locked in contracts at the beginning of 2020 to as much as $15 billion by the end of that year.
Compound was one of the largest DeFi players as it allowed traders to deposit crypto into lending pools that facilitated borrowing. Lenders, in turn, earned an interest on the assets they deposited, fueling the DeFi spree that lasted all summer, with several copy cats and similar protocols offering the service to market participants.
A wave of food-themed DeFi tokens flooded the market, with SushiSwap (SUSHI), BurgerSwap (BURGER), Yam Finance (YAM), BakerySwap (BAKE), Pizza (PIZZA), Hotdog.Swap (HOTDOG), and Kimchi Finance (KIMCHI) taking the lead. Capital rotated from these assets to Bitcoin and BTC’s rally in the first half of the cycle was also driven largely by retail traders.
Later, MicroStrategy’s incursion into Bitcoin started the era of mass institutional participation in crypto. Investment banks, funds and hedge funds turned to Bitcoin as an opportunity to amass returns for their clients. Tesla’s $1.5 billion Bitcoin purchase in 2021 contributed to the shift of traditional markets’ attention into the crypto ecosystem, leading to a rally in Bitcoin price that was fueled by a frenzy among large wallet investors and institutions.
Whale transactions worth $1 million or higher, represented in blue, climbed steadily throughout 2020, hitting a peak in early 2021 and Q3 2021. This signals an increase in participation by large wallet investors on the Bitcoin network in the 2020-2023 cycle.
Whale transaction count (valued at $100,000 or higher), represented by yellow bars, peaked in the months leading up to BTC’s run up to its peak of $69,044.71 in November 2021. The chart below focuses on the role of whales in Bitcoin price cycles and the critical role played in the 2021 bull run.
%20[19.56.11,%2024%20May,%202023]-638205390803367188.png)
Bitcoin whale participation and activity
Whales emerged as one of the dominant catalysts in Bitcoin’s price cycles. When BTC price hit its all-time high of $69,044.71, both segments of whale transactions climbed to their peaks, highlighting the importance of these participants in Bitcoin’s cycles.
Rising whale transaction count can therefore be considered a sign of an impending BTC price rally, based on data from the 2015 to 2017 and the 2020 to 2023 cycles. While Bitcoin price cycles do not repeat, and the catalysts which start them can change, there seems to be a common factor pushing the BTC price higher every time: whales.
Author

Ekta Mourya
FXStreet
Ekta Mourya has extensive experience in fundamental and on-chain analysis, particularly focused on impact of macroeconomics and central bank policies on cryptocurrencies.



