Hedera price surges more than 25% following a spike in trading volume
- Hedera extends its gains rallying more than 25% on Monday after a 64% surge last week.
- Canary Capital filed an S-1 registration for an HBAR ETF last week, fueling the gains.
- HBAR’s daily trading volume reaches 1.4 billion on Monday, indicating a recent surge in traders’ interest.
Hedera (HBAR) price surges more than 25% on Monday after rallying 64% last week. The rally was fueled by Canary Capital, which submitted an S-1 registration to the US Securities & Exchange Commission (SEC) for an HBAR exchange-traded fund (ETF), offering investors exposure to the crypto asset’s price. HBAR’s daily trading volume reached 1.4 billion on Monday, indicating a recent surge in traders’ interest, possibly hinting at further gains.
Canary Capital seeks SEC approval for HBAR ETF
On November 12, Canary Capital submitted an S-1 registration statement to the SEC for a Hedera HBAR spot ETF. This is the first time an asset manager has proposed an ETF for HBAR.
ETF fillings by big investment companies are generally positive signs for Hedera in the long term, as an ETF can make it easier for traditional investors to gain exposure to HBAR without needing to purchase and store the cryptocurrency directly. Moreover, approving an HBAR could lend more legitimacy to HBAR and increase liquidity.
Due to this announcement, the platform’s daily trading volume has risen sharply from 655.61 million on November 12 to 1.44 billion on Monday, the highest level since mid-April, when Hedera’s price surged over 100% after confusing news about investment firm BlackRock being directly involved in tokenization at Hedera. However, after BlockRock denied such news, HBAR price lost all gains in the next seven days.
Still, the recent increase in trading volume following Canary Capital’s submission for HBAR spot ETF indicates a surge in traders’ interest and liquidity in HBAR.
%20[14.39.42,%2018%20Nov,%202024]-638675298500248357.png)
HBAR daily trading volume chart. Source: Santiment
Hedera Price Forecast: Bulls remain strong
Hedera’s price increased more than 64% last week. As of Monday, it has extended its gains, breaking above the weekly resistance level of $0.090 and trading higher around $0.111.
If HBAR continues its upward momentum and closes above $0.090, it may first rally to retest its 61.8% Fibonacci retracement level (drawn from April’s high of $0.181 to October’s low of $0.041) at $0.128. A successful weekly close above $0.128 would extend the rally to retest its yearly high of $0.181.
The Relative Strength Index (RSI) momentum indicator on the weekly chart trades at 68 and points upwards, indicating the bullish momentum is gaining traction while still below overbought conditions.
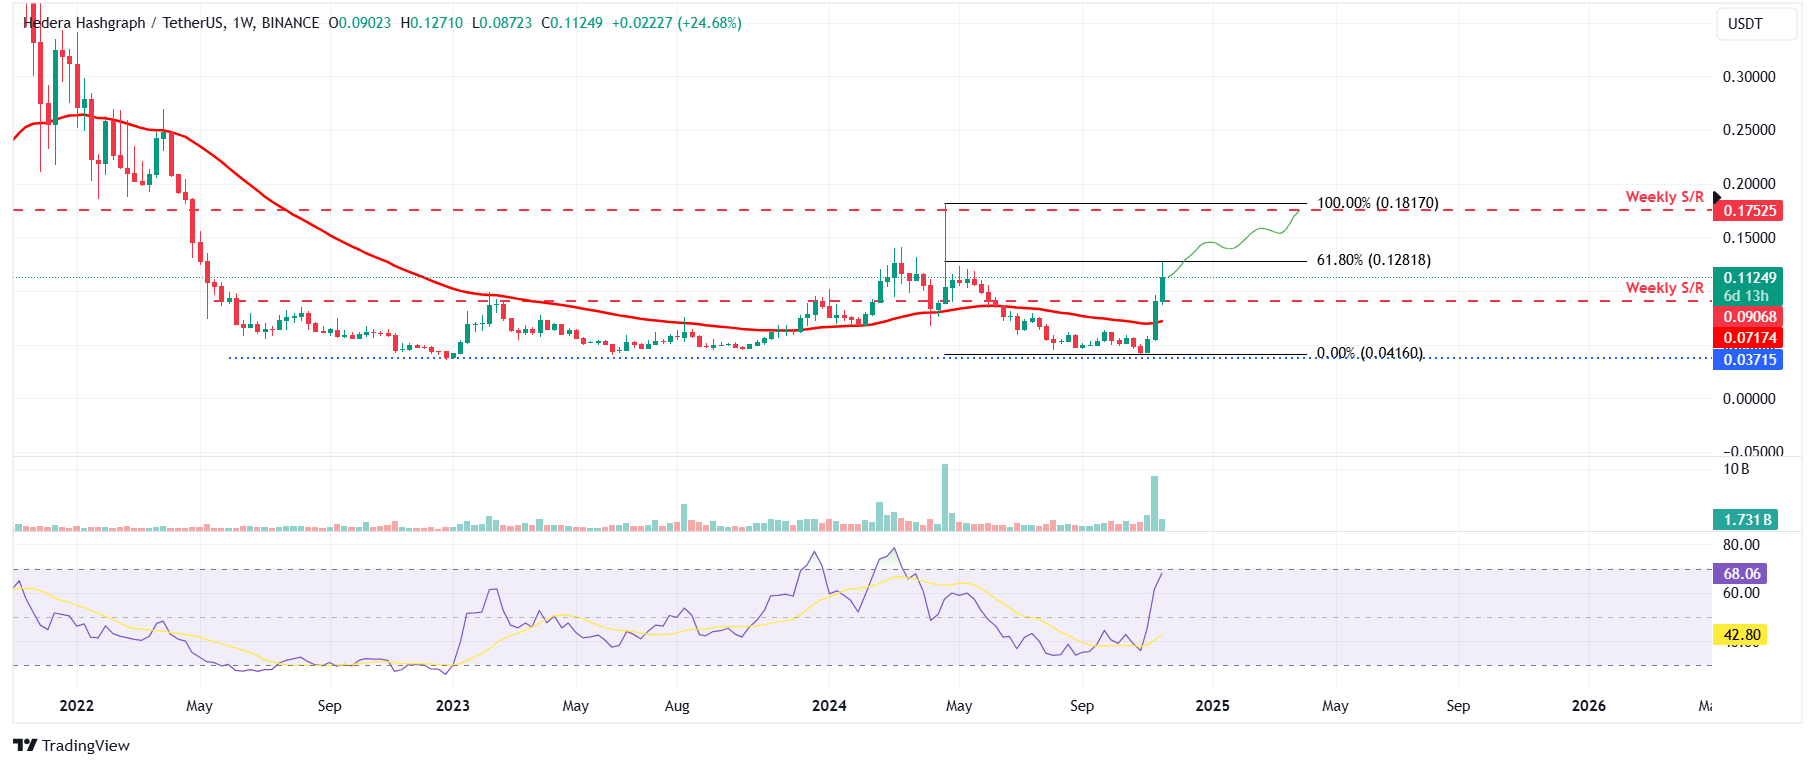
HBAR/USDT weekly chart
Author

Manish Chhetri
FXStreet
Manish Chhetri is a crypto specialist with over four years of experience in the cryptocurrency industry.


