Hedera Hashgraph price: This is why HBAR’s 21% rally could be coming to an end
- Hedera Hashgraph price jumped to trade from $0.036 to $0.044, registering a 21.35% rise in mere four days.
- If the buyers continue their push, Hedera Hashgraph price could be able to tag $0.050 over the next few days.
- Traders looking to cash in on the rise could induce some selling pressure which, if exceeds the demand, could result in a price decline to December 2022 lows.

Hedera Hashgraph price has been the recipient of the recovery bullishness noted across the crypto market, which brought the total value of all cryptocurrencies above $800 billion. The altcoin is inching closer to tagging the December 2022 highs but would need to note a sustained positive momentum to achieve the same.
Hedera Hashgraph price on a rise
Hedera Hashgraph price observed a 21.35% increase in value over the last few days, which raised the value of the altcoin to $0.044. HBAR is now looking to tag $0.050, for which the cryptocurrency would need to mark an 11% rise.
This would be achievable if Hedera Hashgraph price could flip the immediate resistance level at $0.046 into a support floor. Doing so would provide HBAR with the room it needs to tag the critical resistance level at $0.049. Breaching it would enable the cryptocurrency to rise further and rally beyond $0.050.
However, as per the Moving average Convergence Divergence (MACD) indicator, this bullishness could be coming to an end.
The signal line (red) could be seen overlapping with the MACD line (blue), which suggests the bullish sentiment might be fading. The declining green bars on the histogram point in the same direction.
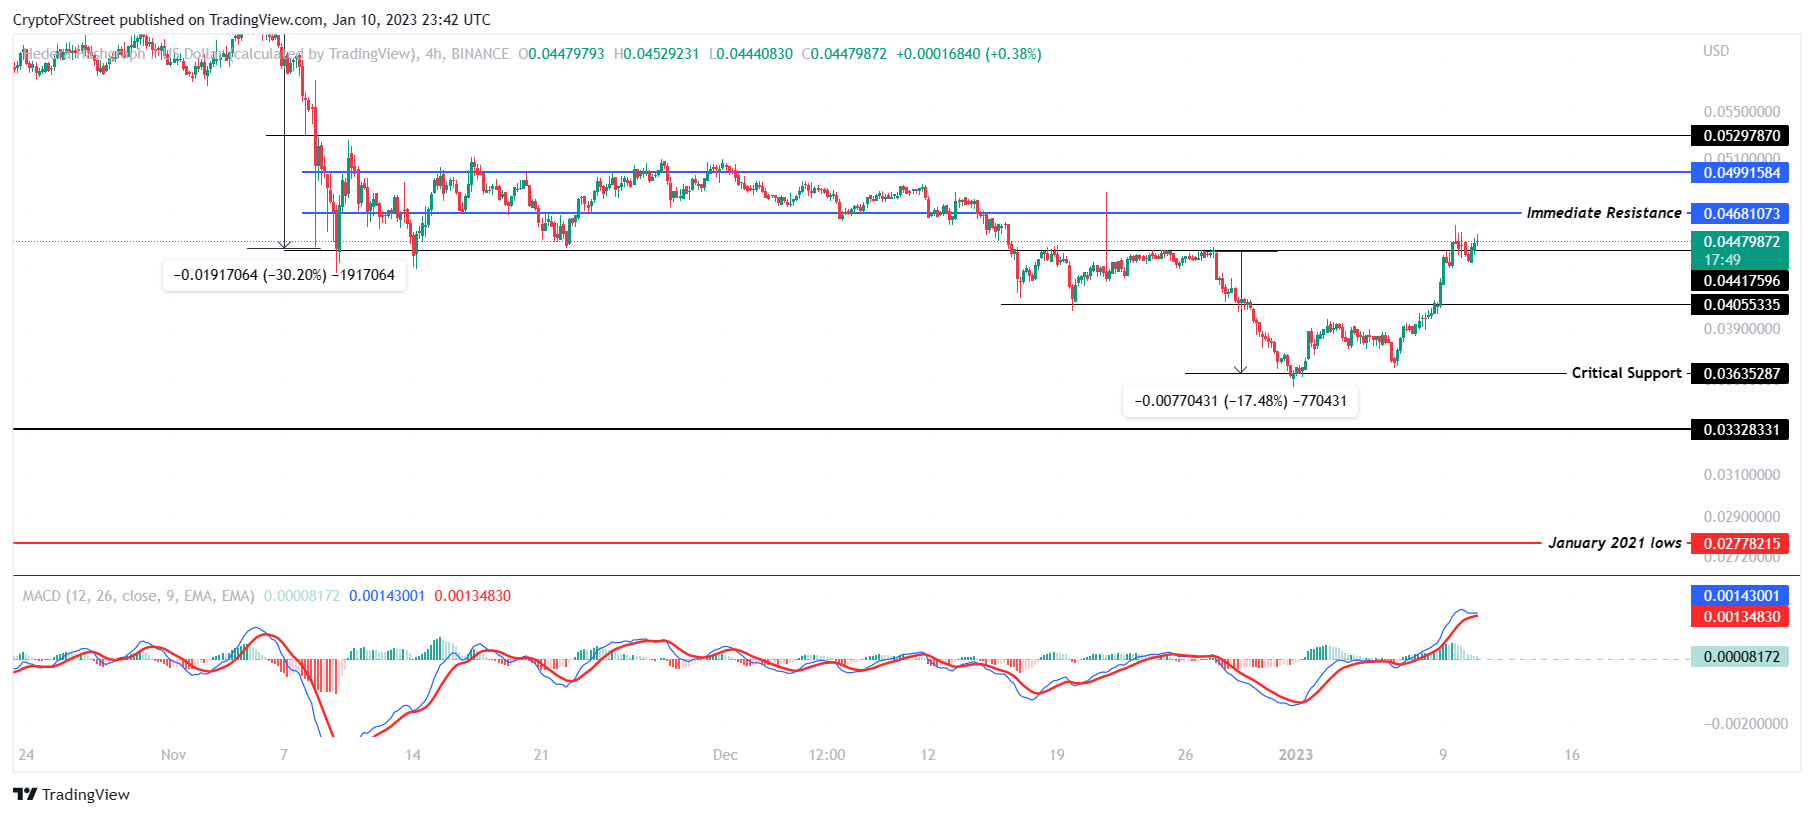
HBAR/USD 4-hour chart
Should this play into effect, a price decline would lead to Hedera Hashgraph price falling below $0.044 and tagging the support level at $0.040. A further decline would bring HBAR to the critical support level at $0.036, providing the cryptocurrency with another chance to bounce off of it.
A daily close below this line, however, would invalidate the bullish thesis, resulting in a fall to $0.033.
Author

Aaryamann Shrivastava
FXStreet
Aaryamann Shrivastava is a Cryptocurrency journalist and market analyst with over 1,000 articles under his name. Graduated with an Honours in Journalism, he has been part of the crypto industry for more than a year now.



