Hedera Hashgraph price prediction: January 2021 lows might be closer than you think
- Hedera Hashgraph price lost over 17% towards the end of 2022, bringing the price down to $0.036.
- The necessary condition for recovery would be met if the altcoin managed to flip the downtrend by reclaiming $0.040.
- If the bulls fail to play their cards now and HBAR slips to $0.033, the bullish thesis will be invalidated.

Hedera Hashgraph price has been consistently declining even before the FTX collapse impacted the crypto market. However, unlike many major altcoins, HBAR has been unsuccessful in recovering any of its recent losses, noting another significant dip over the last few days.
Hedera Hashgraph price slips further
Hedera Hashgraph price fell by over 17% towards the end of 2022 in addition to the 30.2% losses from the FTX-induced November crash. Consequently, within two months price of the asset declined from $0.064 to $0.038 at the time of writing. Although there has not been much improvement in HBAR’s movement, some possibility of recovery remains, provided the altcoin can muster some bullish momentum.
The immediate resistance for Hedera Hashgraph price is currently at the $0.040 mark reclaiming, which would boost its rise. If buyers take charge of the market, HBAR will gain some ground to breach and establish $0.044 as a support floor. Recovery could begin from this point and push the altcoin to reclaim $0.052.
However, as observed by the Parabolic Stop and Reverse (SAR) indicator, the Hedera Hashgraph price is predominantly downtrend and might stay that way. The indicator’s blue dots above the candlestick shows the active trend is a downtrend, and on the macro timeframe, the downward momentum is also highly likely.
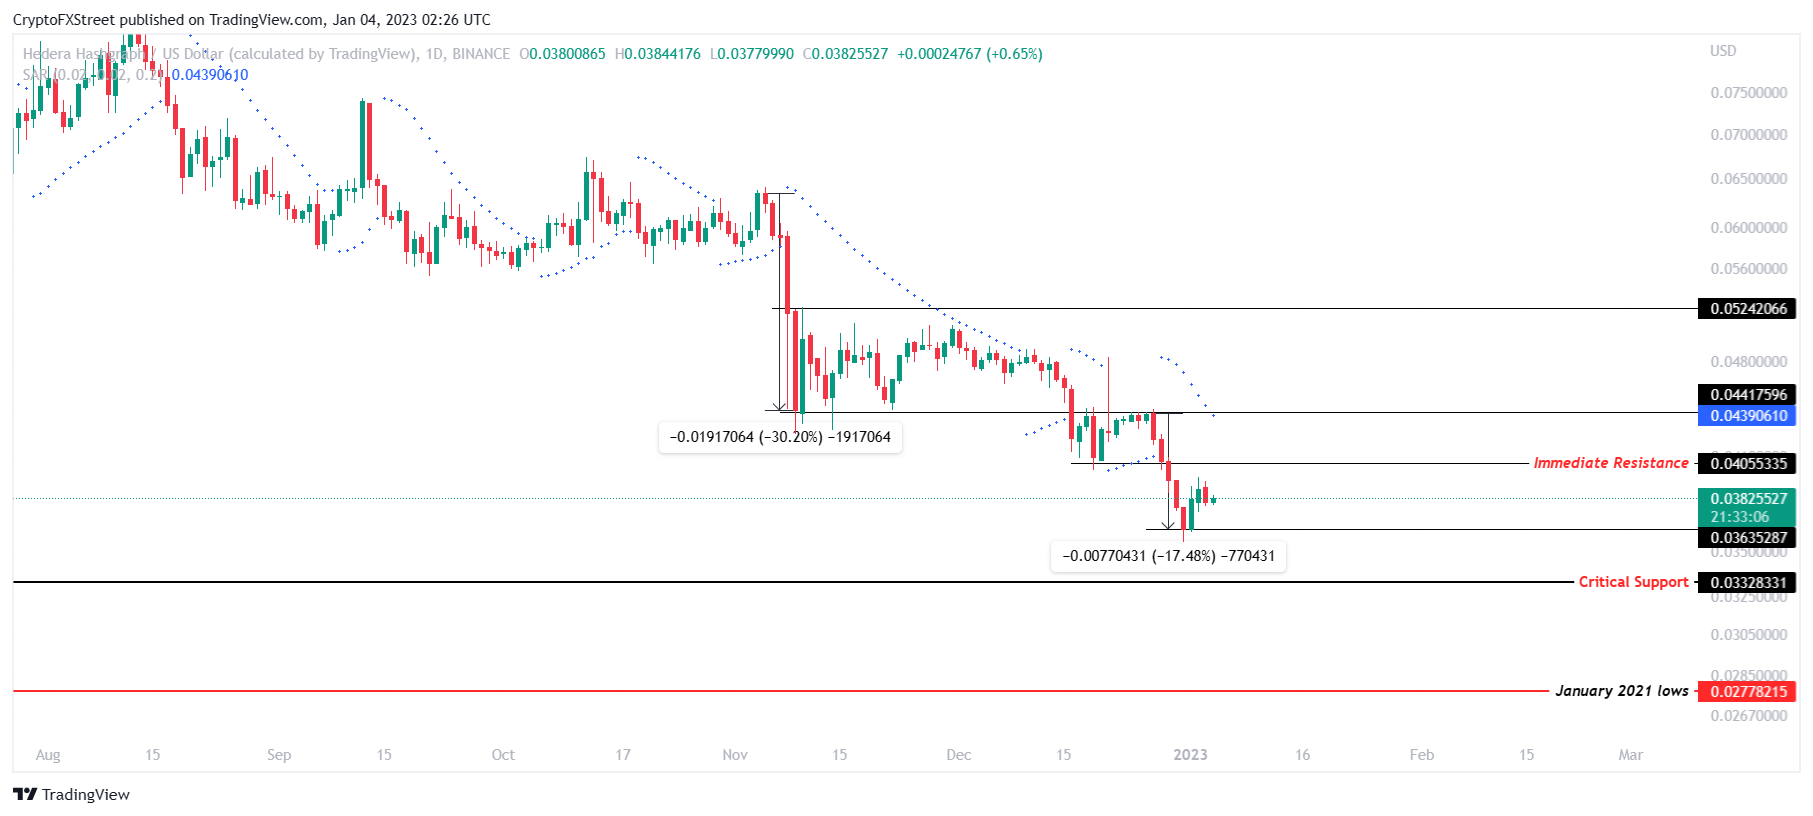
HBAR/USD 1-day chart
Thus investors must be wary of a possible decline and should jump into investing accordingly. If the price of the altcoin slips below its immediate support level of $0.036, the cryptocurrency would still have a chance at bouncing off its critical support at $0.033.
However, losing this support level would invalidate the bullish thesis and set Hedera Hashgraph price toward January 2021 lows of $0.027.
Author

Aaryamann Shrivastava
FXStreet
Aaryamann Shrivastava is a Cryptocurrency journalist and market analyst with over 1,000 articles under his name. Graduated with an Honours in Journalism, he has been part of the crypto industry for more than a year now.



