Hedera Hashgraph price eyes a 30% rally after recovering FTX crash’s losses
- Hedera Hashgraph price rescinded its gains on Tuesday as the altcoin slipped to trade at $0.063.
- Revival of buying pressure will restart the uptrend and push HBAR toward its critical resistance at $0.076.
- Losing its immediate support will leave the altcoin vulnerable to a decline to $0.049, losing, which would invalidate the bullish thesis.

Hedera Hashgraph price has managed to become one of the very few cryptocurrencies in the world to recover the losses it faced in November 2022 following the FTX collapse. The altcoin has room for further increase, provided it can protect its recent growth.
Hedera Hashgraph price in a dilemma
Hedera Hashgraph price is hovering right above its immediate support level at $0.063, trading at $0.064. Since the beginning of the month, HBAR has been posting green candles, managing to rise by nearly 100% in the span of three weeks touching $0.072 a few days ago.
Thus considering that enthusiasm, the recent decline can be attributed to a break following the rally. This would indicate that Hedera Hashgraph price still has some potential for a further rise. For the same, bulls will have to support the altcoin in its recovery and push HBAR above the resistance level at $0.069.
The golden cross that formed on the charts after the 50-day Exponential Moving Average (EMA) crossed over the 200-day EMA persists.
This indicates that the Hedera Hashgraph price’s bullishness remains intact, giving it room to rise toward the critical resistance at $0.076, provided it can flip $0.069 into a support floor. Once breached, the critical resistance will open the path for HBAR to tag $0.084 and mark a 30% rally.
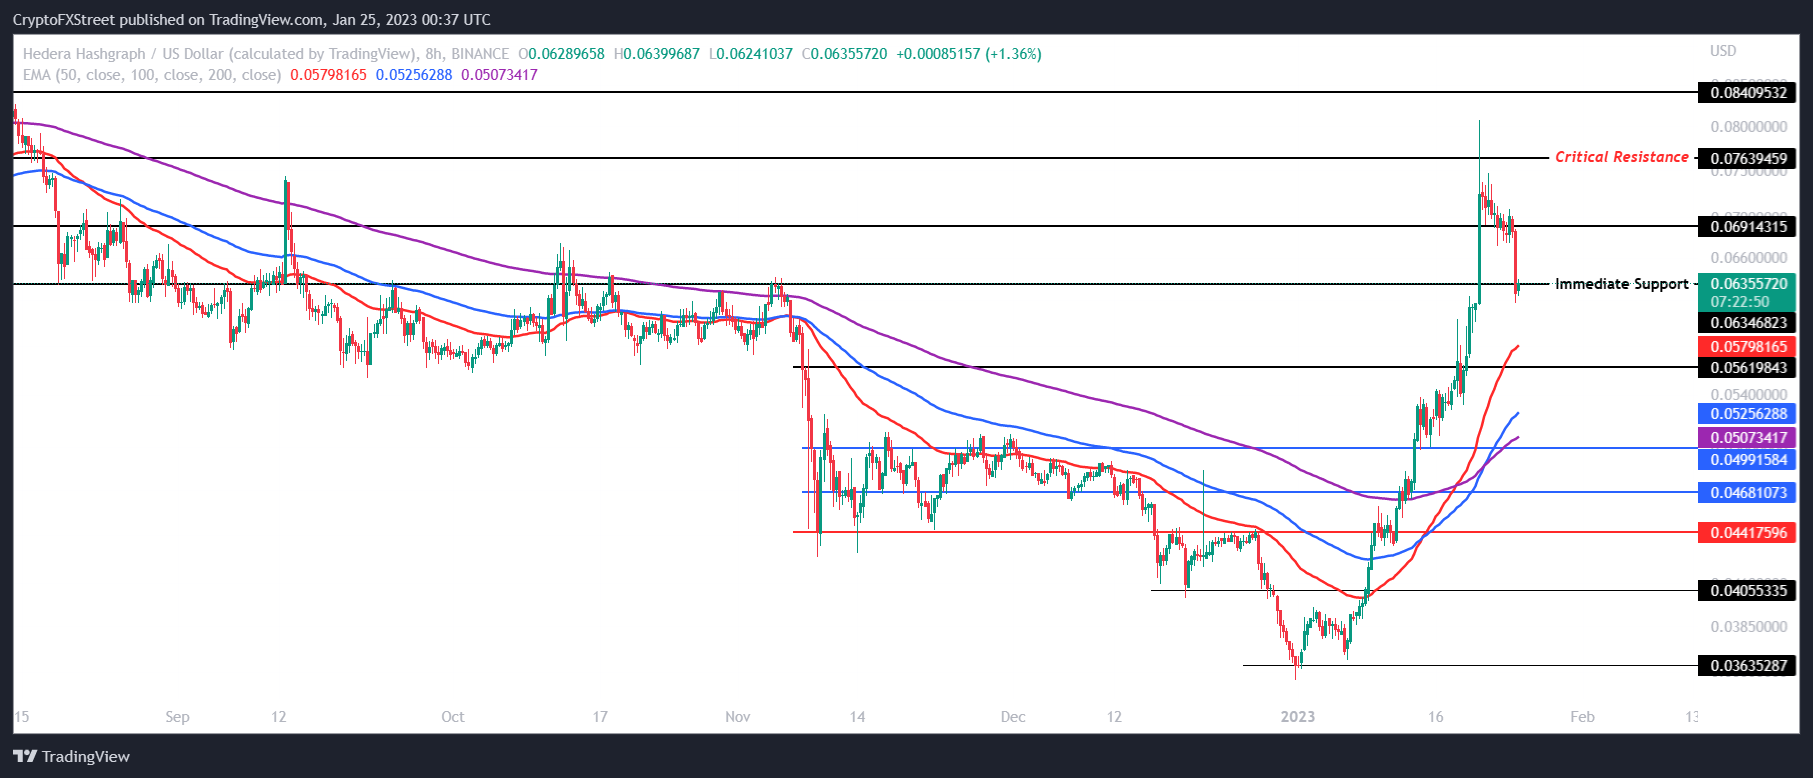
HBAR/USD 8-hour chart
Nevertheless, traders should watch for the fact that the candlesticks have already slipped below the immediate support level. Any further decline would sink Hedera Hashgraph price to $0.056.
Sustaining this critical support is important for HBAR to maintain its November 2022 recovery. However, a daily candlestick close below this level would invalidate the bullish thesis, resulting in the altcoin falling to $0.049.
Author

Aaryamann Shrivastava
FXStreet
Aaryamann Shrivastava is a Cryptocurrency journalist and market analyst with over 1,000 articles under his name. Graduated with an Honours in Journalism, he has been part of the crypto industry for more than a year now.


