GMX price crashes nearly 27% in a day to jeopardize a potential 48% rally target
- GMX price trades at around $55 after suffering a 27% intraday drop.
- The altcoin successfully completed an inverse head and shoulders pattern, breaking out over the past week.
- The decline has set the 48% target rally back but has not invalidated the bullish potential yet.

The anticipation surrounding the approval of the spot Bitcoin ETFs has given not just BTC but altcoins a bullish push over the last weeks, too evident in the GMX price action. The altcoin is witnessing a breakout from a bullish pattern, which sets the target price of the cryptocurrency at $80. However, Wednesday´s price action could jeopardize GMX bullish potential.
GMX price turns heads and shoulders
GMX price is trading at $55 at the time of writing, following a 9% decline since the beginning of the day. Although the 9% correction might seem steep, it is one-third of the lowest point GMX fell to during the day when it crashed by almost 27%. This drop nearly invalidated the bullish breakout observed by the altcoin in the last few days.
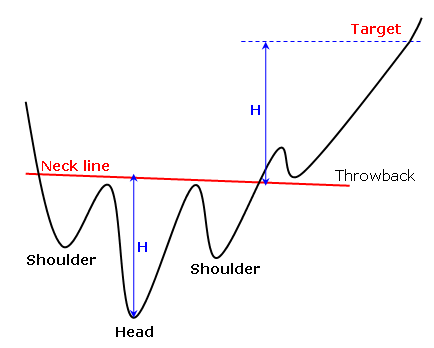
Satisfying the inverse head and shoulders pattern, GMX price breached the neckline to hit a six-month high. The inverse head and shoulders, also known as the reverse head and shoulders pattern, observes a downtrend and indicates a reversal of the downtrend as higher lows are created.
Inverse head and shoulders pattern
This pattern is useful in identifying the overall market trend as well as the macro bullish breakout of the asset.
The lowest point of the formation is considered to be the head, and the double bottoms formed at the same support line make up the shoulders. In the case of GMX, these lie at $30 and $43, respectively. Furthermore, the target of the breakout is derived from the distance between the head of the pattern and the neckline.
Thus, according to the pattern, the target for GMX price stands over 48% above the current price level of $79.
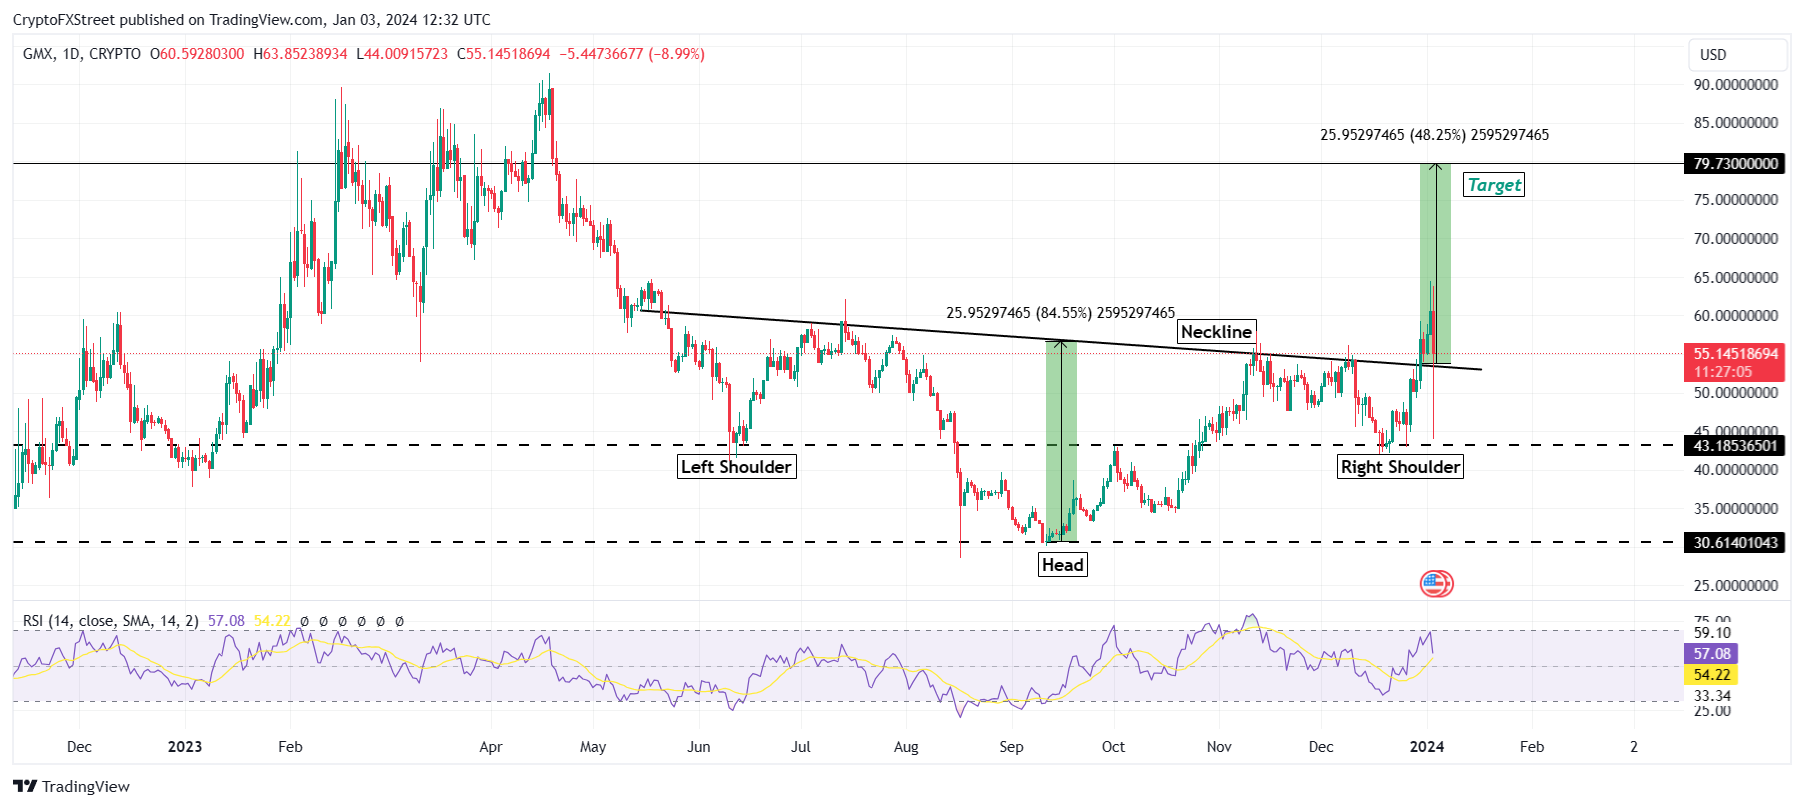
GMX/USD 1-day chart
However, a fall through the neckline and below the shoulders support line generally indicates a failure of the pattern. This almost happened during the intra-day trading hours, but GMX is trading above the neckline at the time of writing. This gives it a chance at bouncing back and re-rallying.
However, if Wednesday’s lows solidify in the future, the bullish thesis would be invalidated, leaving GMX price susceptible to a crash to $40.
Author

Aaryamann Shrivastava
FXStreet
Aaryamann Shrivastava is a Cryptocurrency journalist and market analyst with over 1,000 articles under his name. Graduated with an Honours in Journalism, he has been part of the crypto industry for more than a year now.


