- FTX bankruptcy proceedings will not include the $550 million worth of Robinhood shares, which remain seized by the Department of Justice.
- Emergent Fidelity only has about $20.7 million in cash at the moment, with no other assets.
- FTT price has been consolidated between $2.4 and $1.7, trading at $2.0 at the moment.
FTX saga added another eventful moment to its list after a company with no direct connection to FTX filed for bankruptcy. The repercussions that arose from the ongoing bankruptcy proceedings reached Emergent Fidelity through the one common link, Sam Bankman-Fried.
FTX CEO Sam Bankman-Fried loses another company
Sam Bankman-Fried owned Emergent Fidelity Technologies along with FTX. The company was also the responsible offshore entity that was home to the 55 million Robinhood shares worth more than $550 million.
However, the company went ahead and filed for bankruptcy on Friday despite the Department of Justice providing no clear answer about the ownership of the shares.
The Chapter 11 bankruptcy filing will allow the liquidators to work through the situation. Commenting on the same, a liquidator in a court statement said,
“ [The liquidators] duties are to the debtor’s creditors, whoever those creditors may be. Given the many parties claiming to be creditors or outright owners of the debtor’s assets in proceedings in the US, the JPLs believe that Chapter 11 protection is the only practical way to empower the debtor to defend itself, the assets, and its creditors’ interests in the US.”
Sam Bankman-Fried, despite being no longer in control of the company, owns nearly 90% of the entity, with FTX co-founder Gary Wang owning the remaining 10% of the company. Whether or not the Department of Justice returns the Robinhood shares cannot be ascertained, but for now, the company has only $20.7 million in cash.
FTT price falls into a consolidation
FTT price, following its 26% dip in the last few days, has now consolidated, keeping itself stuck in a sideways momentum between $1.7 and $2.4. Trading at $2.0, the cryptocurrency managed to chart a green candle, rising by more than 7% in the last 24 hours.
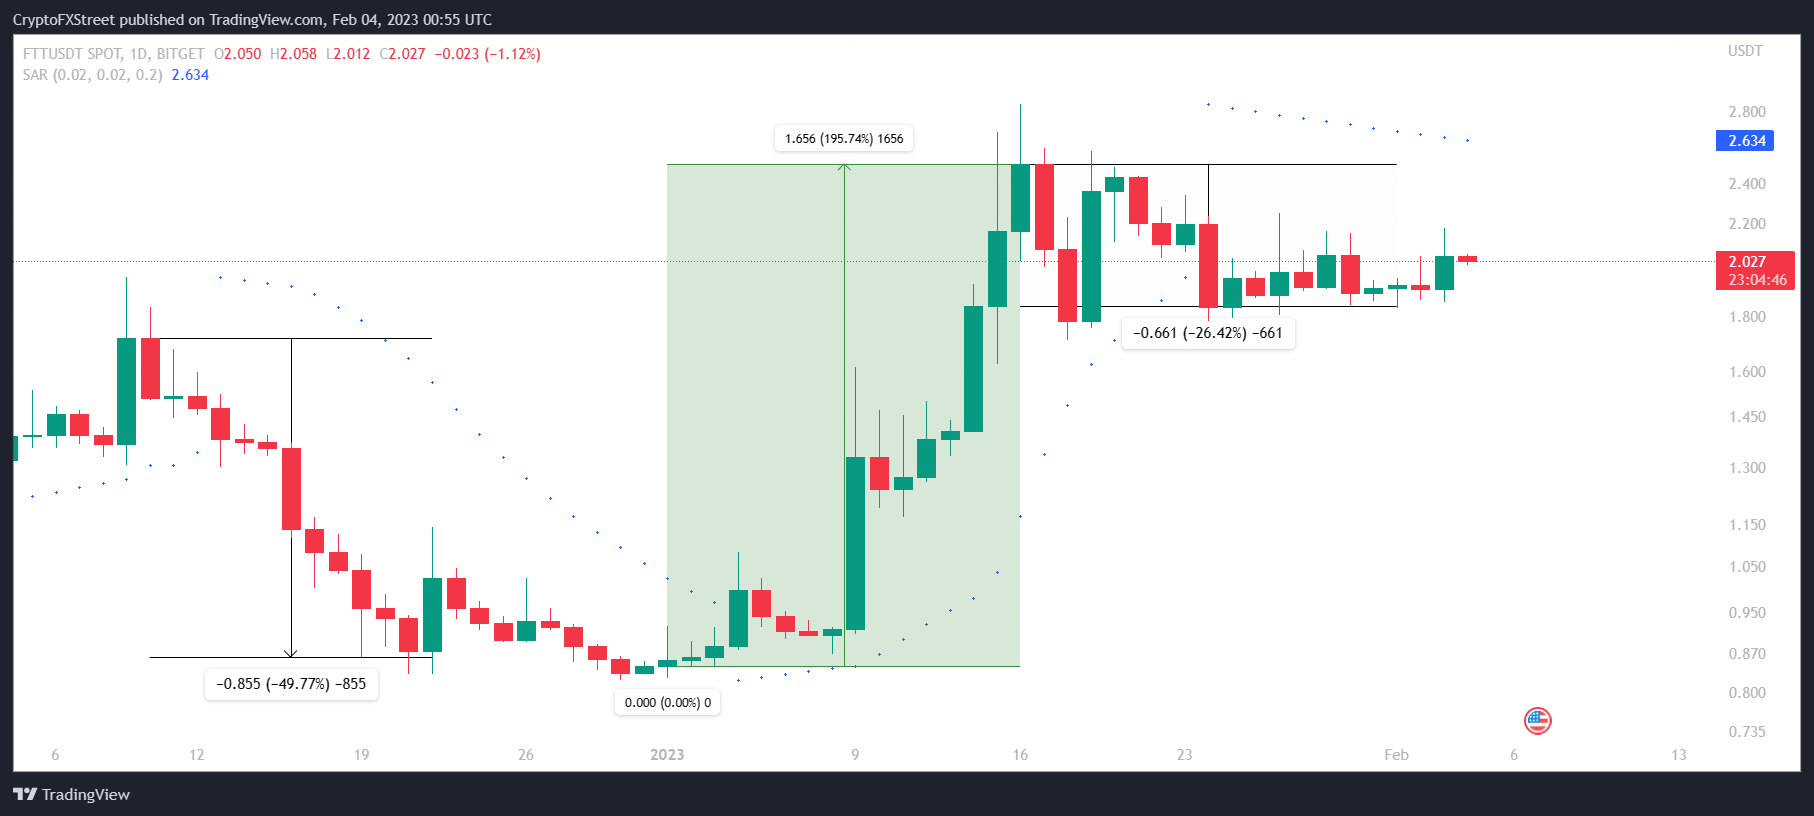
FTT/USD 1-day chart
Any volatile change in the price action would be explained by some outside factor, as the rest of the market is also rather quiet at the moment. As for cryptocurrency traders, laying low would be the way to go.
Information on these pages contains forward-looking statements that involve risks and uncertainties. Markets and instruments profiled on this page are for informational purposes only and should not in any way come across as a recommendation to buy or sell in these assets. You should do your own thorough research before making any investment decisions. FXStreet does not in any way guarantee that this information is free from mistakes, errors, or material misstatements. It also does not guarantee that this information is of a timely nature. Investing in Open Markets involves a great deal of risk, including the loss of all or a portion of your investment, as well as emotional distress. All risks, losses and costs associated with investing, including total loss of principal, are your responsibility. The views and opinions expressed in this article are those of the authors and do not necessarily reflect the official policy or position of FXStreet nor its advertisers. The author will not be held responsible for information that is found at the end of links posted on this page.
If not otherwise explicitly mentioned in the body of the article, at the time of writing, the author has no position in any stock mentioned in this article and no business relationship with any company mentioned. The author has not received compensation for writing this article, other than from FXStreet.
FXStreet and the author do not provide personalized recommendations. The author makes no representations as to the accuracy, completeness, or suitability of this information. FXStreet and the author will not be liable for any errors, omissions or any losses, injuries or damages arising from this information and its display or use. Errors and omissions excepted.
The author and FXStreet are not registered investment advisors and nothing in this article is intended to be investment advice.
Recommended Content
Editors’ Picks
Ripple's move above this key level could trigger nearly 50% rally for XRP
Ripple has overcome a critical resistance level and flipped into a support floor on the weekly time frame. This development happened while XRP tightly consolidated for roughly 250 days. Investors can expect XRP to kickstart a massive rally.
Optimism price outlook with nearly $90 million worth of OP tokens flooding markets on Friday
Optimism volatility has shrunk in the ours leading to the network’s cliff unlock. It joins the likes of dYdX and Sui, which have similar events on their calendars. As token unlocks are often considered bearish catalysts, investors should brace for a reaction after the event.
Top 3 Price Prediction Bitcoin, Ethereum, Ripple: Retail watches from the sidelines with a bias for shorts
Bitcoin could clear $73,777 peak as BTC bulls resurface. Ethereum might fall 10% before next leg up as ETH RSI teases with sell signal. XRP could lose $0.6000 threshold as Ripple bulls fail to show up.
Jito price could hit $6 as JTO coils up inside this bullish pattern
Jito price action shows a potential cup and handle formation. Based on theoretical measurement rules, a successful breakout could yield a 56% rally to $6.0. A breakdown of the $3.86 support level would create a lower low for JTO and invalidate the bullish thesis.
Bitcoin: BTC may have recovered, but is it out of the woods?
Bitcoin’s (BTC) upward momentum has shown a significant decline for the past two weeks or so. This development led to a bearish signal on the weekly and an uncertain outlook on the monthly.