FLOKI price poised for a rally following break above 200-EMA
- FLOKI price faces resistance around $0.000150; a breakout above it signals a potentially bullish move ahead.
- IntoTheBlock's In/Out of the Money Around Price shows the key support zone at $0.000144 and $0.0.000148.
- A daily close below 0.000129 would invalidate the bullish thesis.
FLOKI (FLOKI) price has encountered resistance near the $0.000150 mark during the past week; however, a breakout above this level could indicate a bullish trend.
FLOKI price eyes for a 20% rally
FLOKI price has been facing resistance at the weekly level of $0.000150 for the last five days and trades 1% down at 0.000147 on Thursday.
This weekly resistance coincides with the 200-day Exponential Moving Average (EMA) around $0.000152, making a key resistance zone.
If FLOKI closes above the $0.000152 level, it could rally 20% to retest the July 3 high at $0.000186.
Moreover, a lower low in the daily chart on July 5 contrasts with a higher high observed in the Relative Strength Index (RSI) indicator during the corresponding timeframe. This phenomenon, known as a bullish divergence, typically precedes a trend reversal or a short-term upward movement.
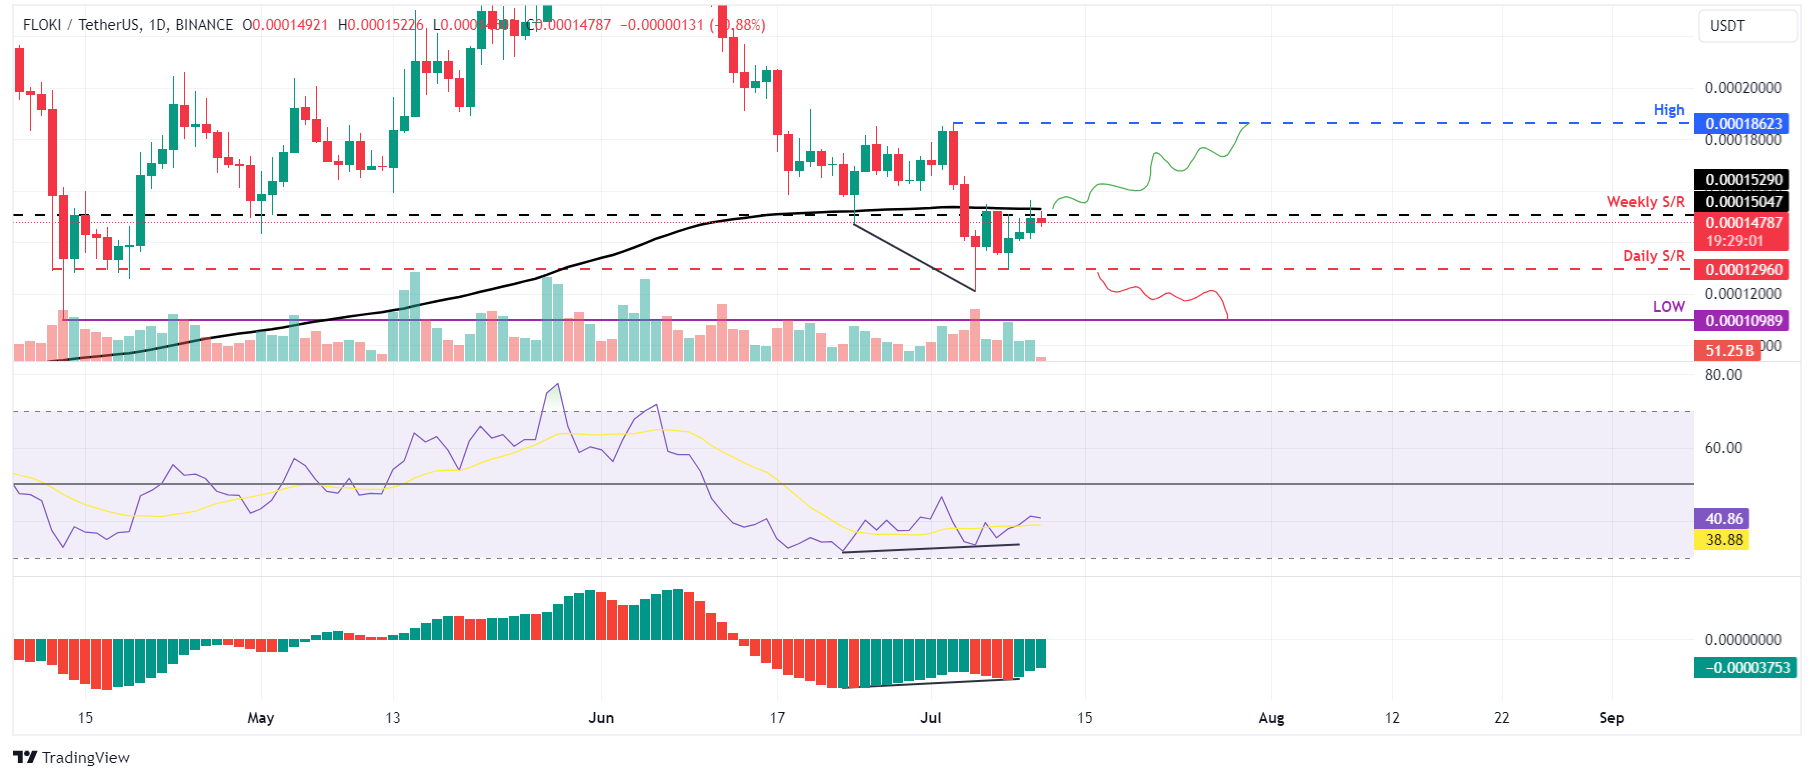
FLOKI/USDT daily chart
Based on IntoTheBlock's In/Out of the Money Around Price (IOMAP), nearly 452 addresses accumulated 66.92 billion FLOKI tokens at an average price of $0.000145. These addresses bought the dog-based meme token between $0.000144 and $0.0.000148, which makes it a key support zone.
Interestingly, $0.000144 and $0.0.000148, the zone mentioned from a technical analysis perspective, coincide with the IOMAP findings, making this zone a key reversal area to watch.
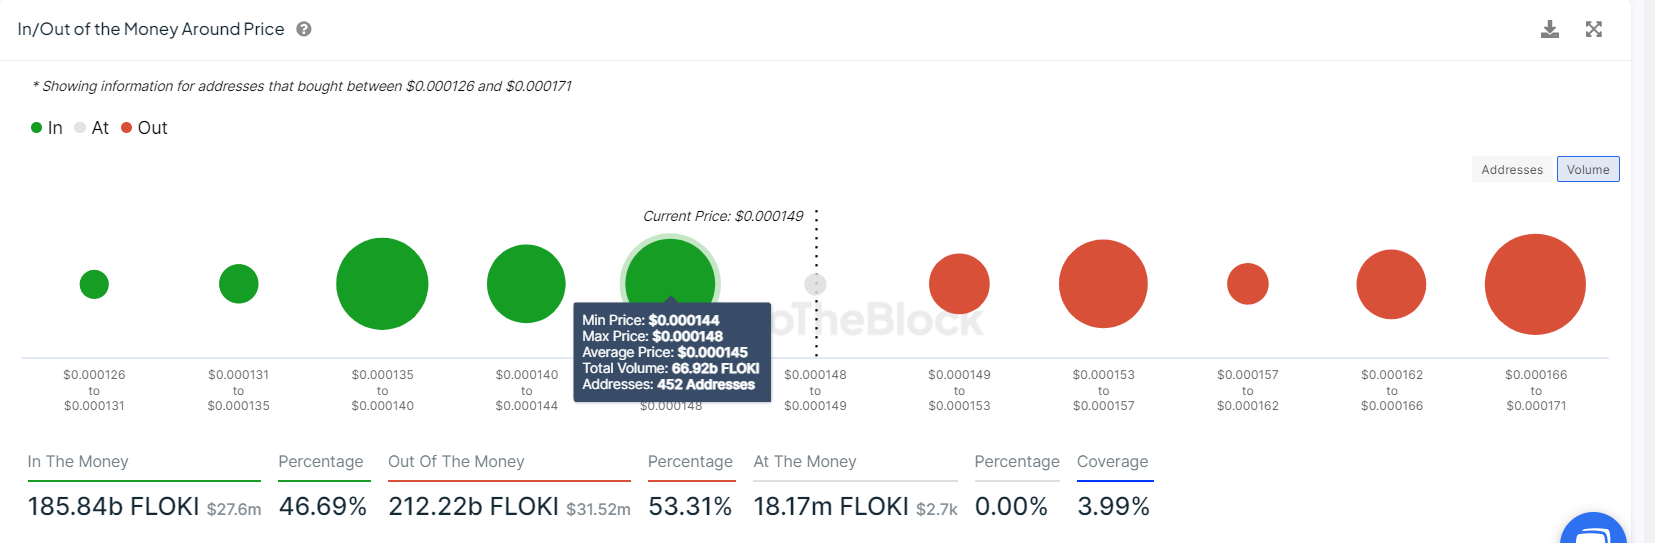
FLOKI IOMAP chart
Despite technical analysis and on-chain data suggesting a bullish move, if FLOKI’s daily candlestick closes below $0.000129 and establishes a lower low on the daily timeframe, it may signal a shift in market dynamics that favors bearish sentiment. Such a change could invalidate the bullish outlook, leading to a 15% crash in the FLOKI’s price to the April 13 low of $0.000109.
Author

Manish Chhetri
FXStreet
Manish Chhetri is a crypto specialist with over four years of experience in the cryptocurrency industry.


