Filecoin Price Prediction: FIL could see consolidation before a 30% crash
- Filecoin price increased by almost 8% to trade at $6.96.
- Mixed indications from the price indicators suggest FIL might end up moving sideways for a while.
- A breach above $9.78 could potentially invalidate the bearish thesis.

Filecoin price was among the few coins to continue its uptrend well into February, with the uptrend beginning to cool down just a few days ago. The altcoin is currently suffering the brunt of the recovering market as investors are acting cautiously, looking for a bullish or bearish signals. If Wednesday’s rally turns out to be a bullish signal, investors could be looking at a good few days.
What if Filecoin price does not act bullish, though?
Trading at $6.95, Filecoin price rose by more than 7.4% at the time of writing, rising above the immediate support level of $6.59. Although whether or not this rise could push the price to a seven-month high is uncertain since no clear indication can be seen on the charts.
The Parabolic Stop and Reverse (SAR) highlights an active downtrend, thanks to the presence of the blue dots of indicator above the candlesticks. The Relative Strength Index (RSI), on the other hand, is still bullish as the indicator bounced off the neutral line at 50.0, suggesting a minor bounce in price is likely.
However, the Moving Average Convergence Divergence (MACD) indicator is bearish as well, with the cryptocurrency experiencing a bearish crossover a few days ago. The signal line (red) crossing over the MACD line (blue) is evidence of the same.
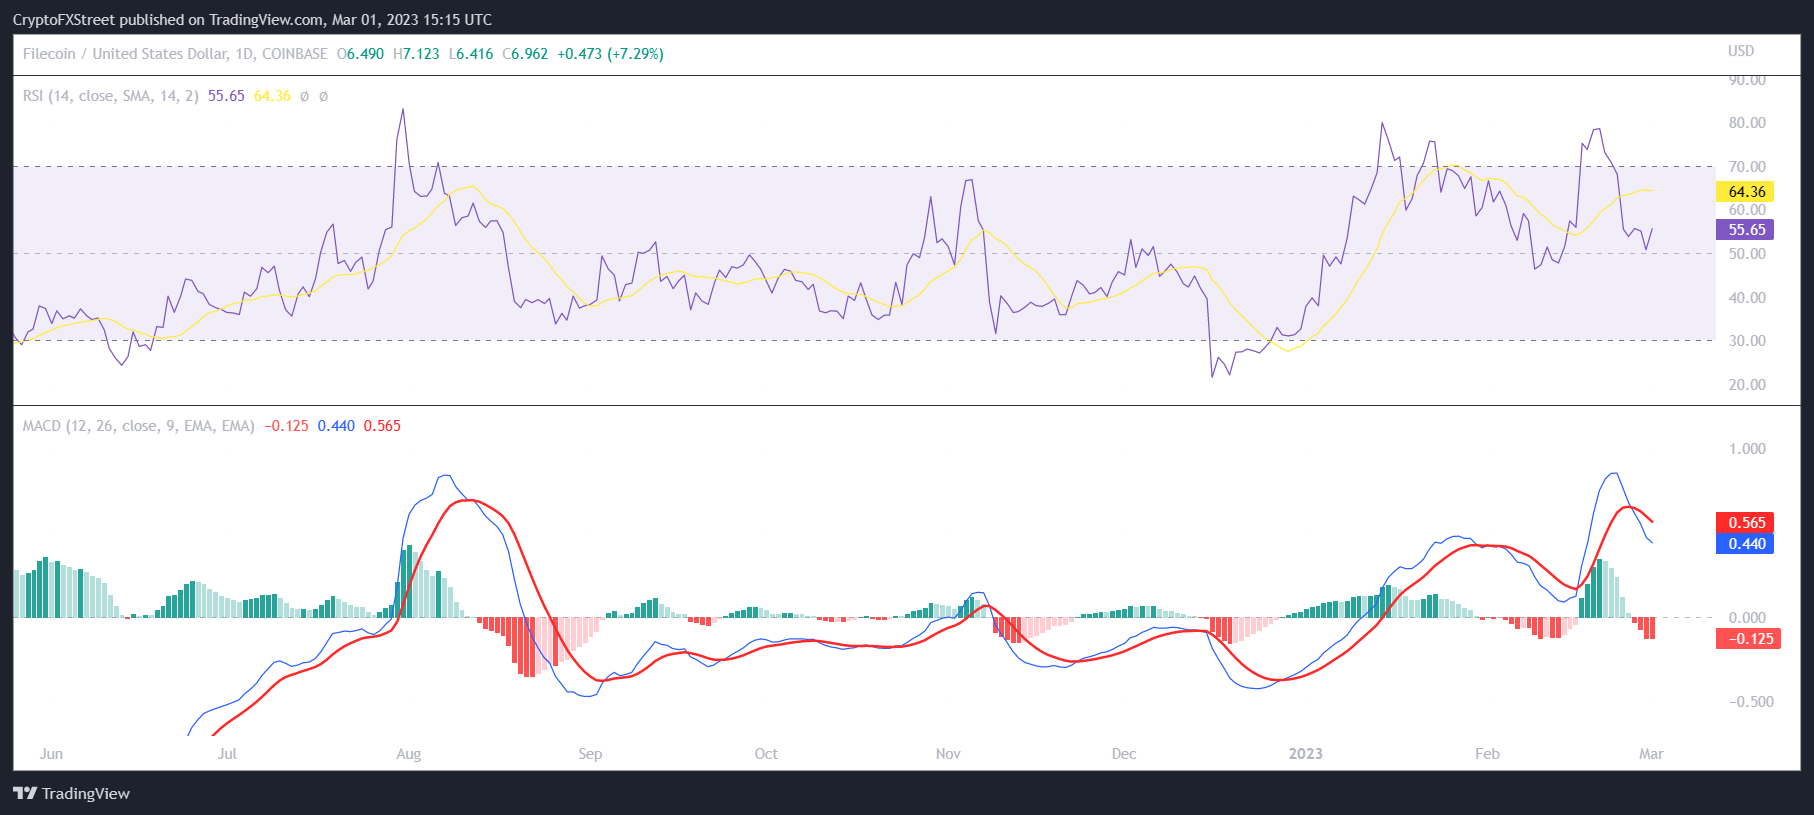
Filecoin MACD and RSI
Thus if the bearish scenario plays out, Filecoin price could end up losing the support at $6.59 and slipping to test the critical support at $4.79. Marking a 30% crash, FIL, from here on, would be vulnerable to a decline below $4.00 if it loses this support level as well.
Although the presence of the 50 and 100-day Exponential Moving Averages (EMAs) could act as support for Filecoin price. Bouncing off of these could push the price back up, and support from buyers could carry FIL above $7.87.
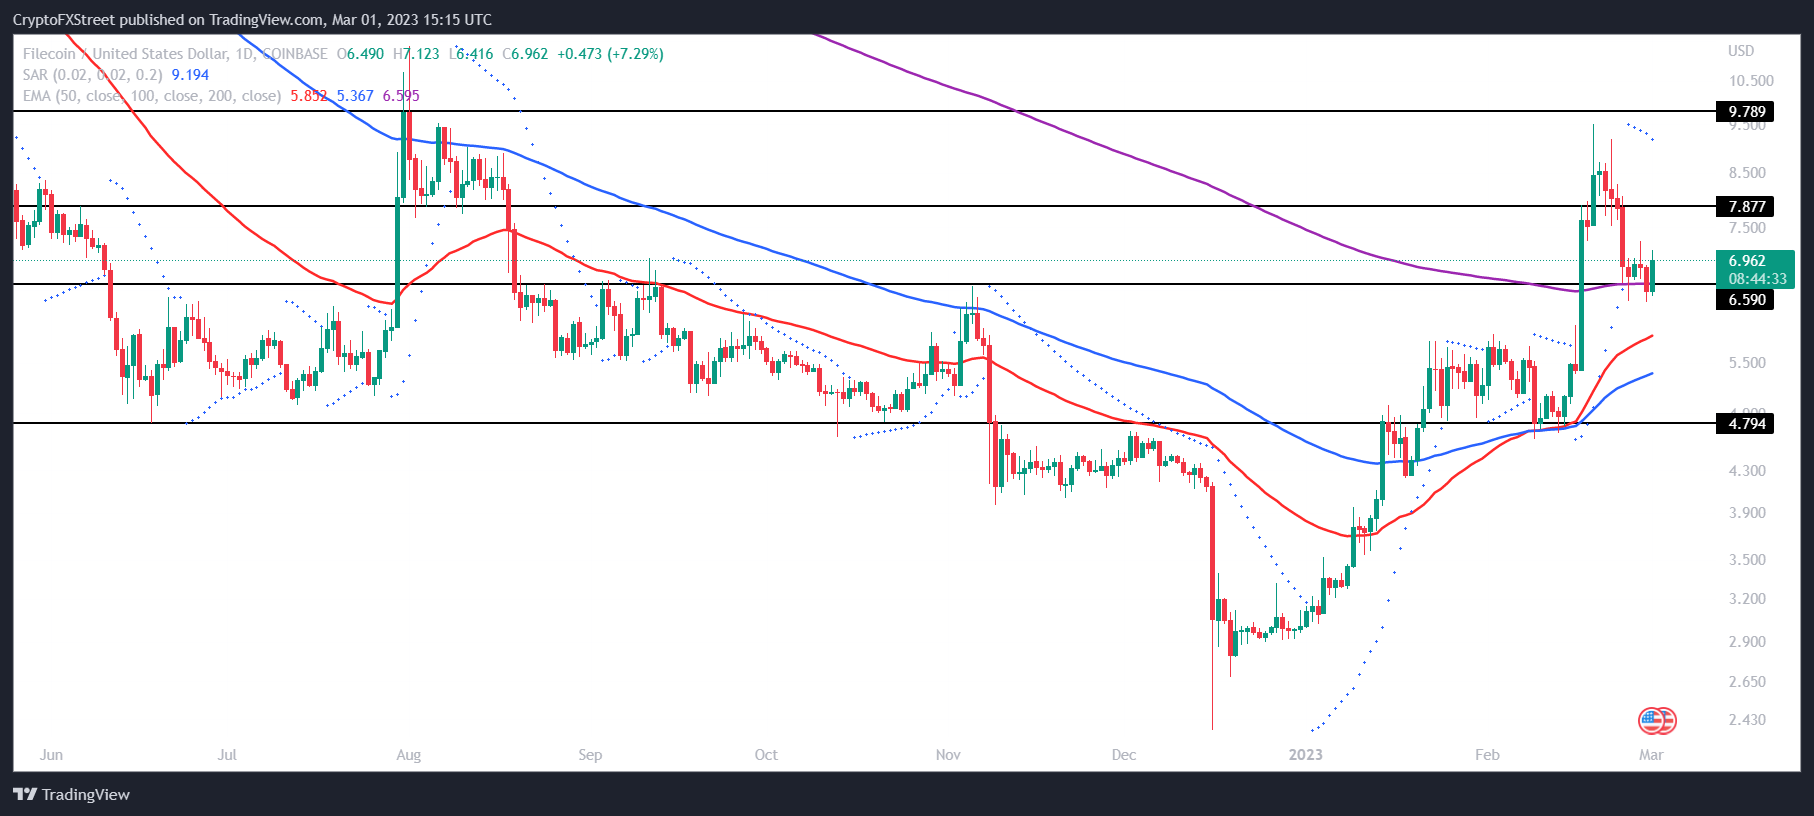
FIL/USD 1-day chart
Flipping it into support would enable the altcoin to rise to $9.78 and test the critical resistance. A daily candlestick close above this level would invalidate the bearish thesis, pushing the price above $9.78.
Author

Aaryamann Shrivastava
FXStreet
Aaryamann Shrivastava is a Cryptocurrency journalist and market analyst with over 1,000 articles under his name. Graduated with an Honours in Journalism, he has been part of the crypto industry for more than a year now.



