Ethereum technical analysis: Looking for support levels
- As all the major cryptocurrencies take a battering today ETH/USD is down 5.6%.
- Volume is heavily backing the sell-side and there could be some support coming up.

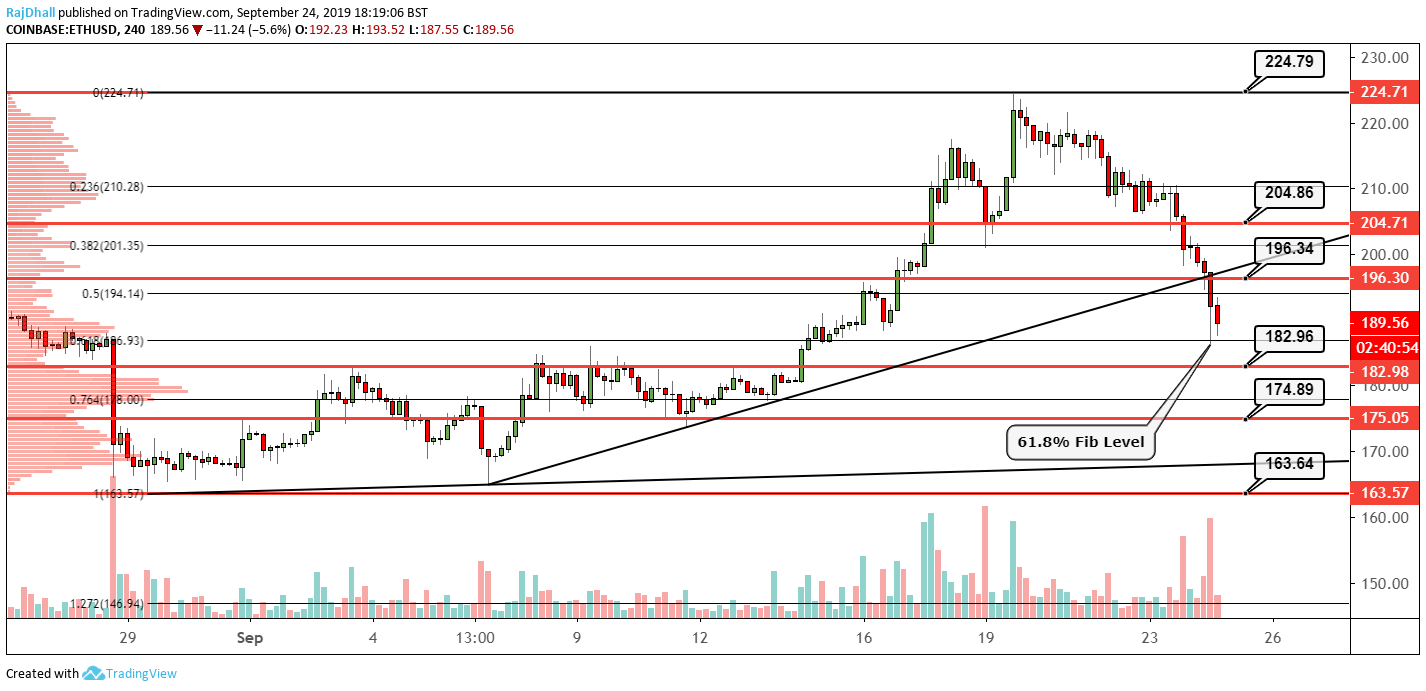
On the four hour chart below ETH/USD is currently in freefall.
Looking at the chert the golden Fibonacci ratio of 61.8% is providing some support and price has stalled.
The main support level that is next up on the chart is at 182.96.
On the volume profile, this price is a low volume node which means there is normally not much volume interest there and the level was used as resistance a few times on the left-hand side of the chart.
Elsewhere 163.64 is the main low and if this breaks it would mean on the higher timeframes the downtrend has resumed once again.
This is quite a heavy retracement after the trend changed recently and if we get a move back up the 200.00 psychological level may act as resistance.
Author

Rajan Dhall, MSTA
FX Daily
Rajan Dhall is an experienced market analyst, who has been trading professionally since 2007 managing various funds producing exceptional returns.


