- Ethereum is about to reach the price target as determined by ascending triangle formation.
- The one-hour chart has flashed the sell signal in the TD sequential indicator.
The number 2 cryptocurrency in the world slipped sharply from $475 to $320.25 between September 2 and September 23. Since then, the buyers could wrest back control and push the price up in an ascending triangle formation. As previously reported by FXStreet, the price goal for ETH, as determined by the triangle, is around $475. The buyers are currently on the verge of breaking past this level.
Ethereum to go for $500 soon
The bulls have been in complete control of the market for the last five days, wherein the smart contract platform jumped from $380 to $460. The price has already faced rejection at the $475 resistance barrier. If the buyers manage to overcome this, they should be able to reach $500.
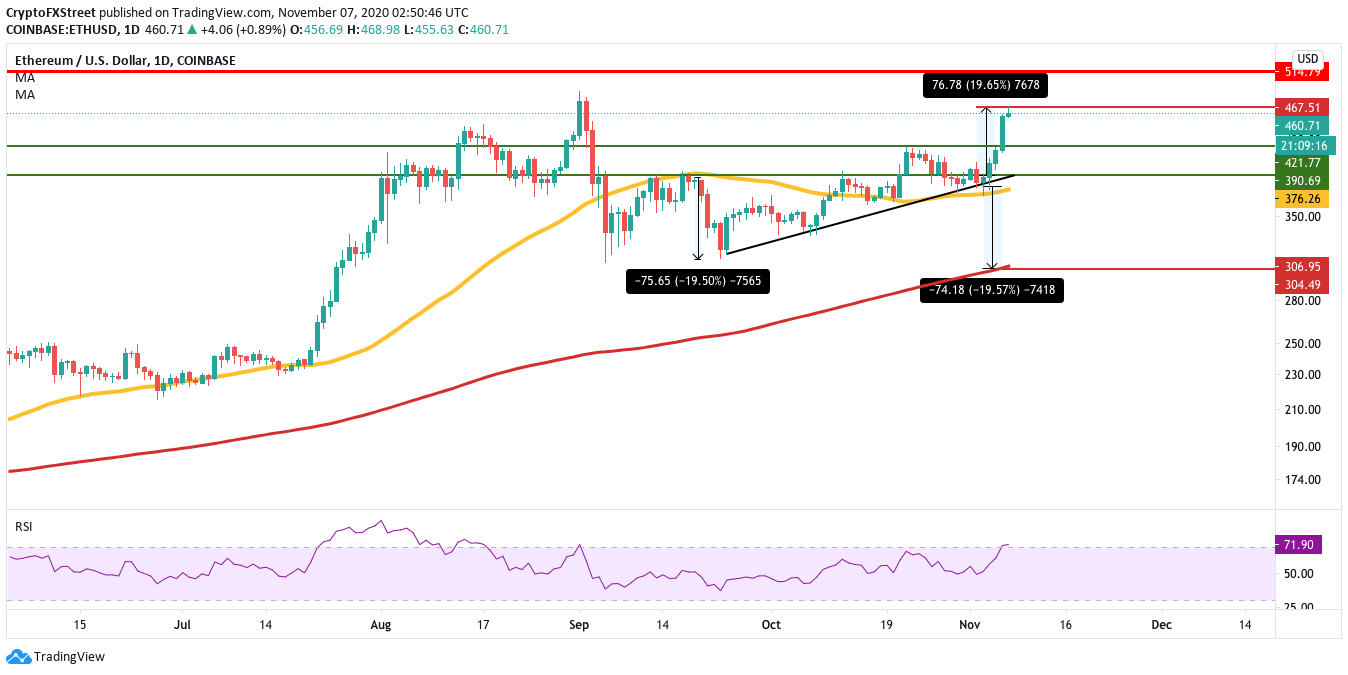
ETH/USD 1-day chart
IntoTheBlock’s In/Out of the Money Around Price (IOMAP) visualizes strong resistance and support walls. As per the IOMAP, the resistance levels upfront aren’t that strong. As such, a break above the $475 barrier should take ETH up to $500.
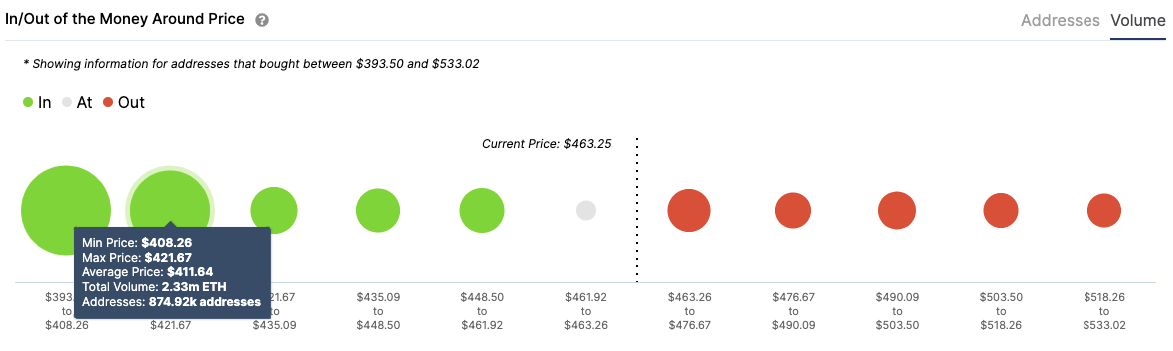
ETH IOMAP
However, it’s not all sunshine and roses for the buyers. The 1-hour chart for ETH/USD has flashed the sell signal via the TD sequential indicator's green-nine candlestick. This should prompt a short-term retracement before the price picks up steam and breaches $500.
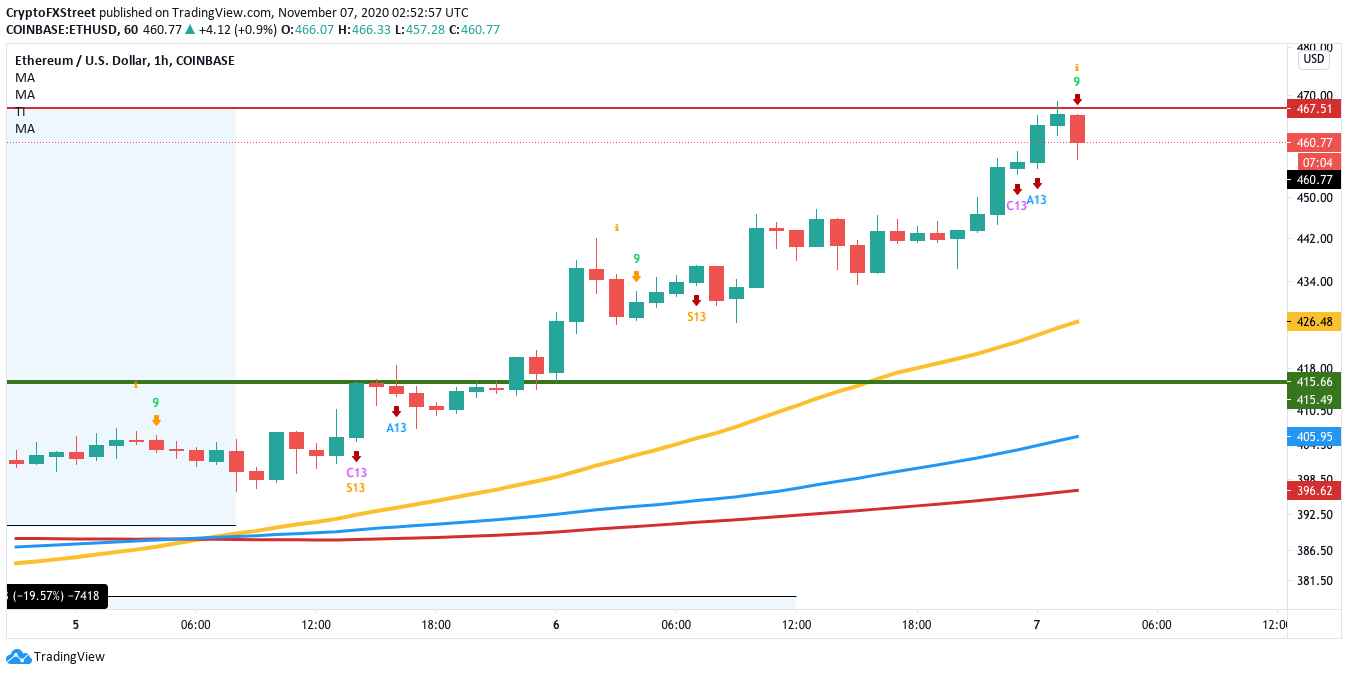
ETH/USD 1-hour chart
The IOMAP shows that there are two support walls at $420 and $400. These two walls should be strong enough to absorb a tremendous amount of selling pressure. If the bears somehow manage to break below these levels, the next viable support lies at the 200-day SMA ($300).
Information on these pages contains forward-looking statements that involve risks and uncertainties. Markets and instruments profiled on this page are for informational purposes only and should not in any way come across as a recommendation to buy or sell in these assets. You should do your own thorough research before making any investment decisions. FXStreet does not in any way guarantee that this information is free from mistakes, errors, or material misstatements. It also does not guarantee that this information is of a timely nature. Investing in Open Markets involves a great deal of risk, including the loss of all or a portion of your investment, as well as emotional distress. All risks, losses and costs associated with investing, including total loss of principal, are your responsibility. The views and opinions expressed in this article are those of the authors and do not necessarily reflect the official policy or position of FXStreet nor its advertisers.
Latest Crypto News & Analysis
Editors’ Picks
XRP Price Forecast: Ripple could be on the verge of a breakout to $0.40
After losing more than 60% of its value in December 2020, XRP has been trading sideways without much action throughout 2021. The SEC has sued Ripple alleging that it conducted illegal sales of XRP which they consider a security.
Bitcoin price shows ambiguity as a 30% move is underway according to technicals
Bitcoin has been trading inside a tight range after establishing a new all-time high at $41,950. The digital asset plummeted down to $30,420 and then formed a lower high at $40,100 followed by what seems to be a higher low at $33,850.
XLM Price Prediction: Stellar awaits a massive breakout but remains inside a no-trade zone
XLM has continued to trade sideways since we last reported about it. The digital asset remains locked inside a tightening range which will eventually burst. Let’s analyze some of the most important indicators to understand the most likely scenario.
Ethereum Price Analysis: ETH bulls facing an uphill task inside short-term triangle
ETH/USD steps back from short-term resistance while declining to $1,256 during early Tuesday. In addition to easing from the immediate triangle’s upper line, Ethereum also drops from a three day high by press time. Monthly top, one-week-old ascending trend line favor bulls.
Bitcoin Weekly Forecast: BTC price faces extreme volatility ahead of a new all-time high
Bitcoin had a wild run this week, dropping from a high of $41,350 to a low of 30,420 in less than 48 hours.