Ethereum price: Why ETH traders are better off with short positions
- Ethereum price shows a descending triangle setup, hinting at a 10% drop.
- Long positions are likely going to be trapped should ETH breach the $1,191 support level.
- A four-hour candlestick close above $1,340 will invalidate the bearish thesis for the smart contract token.

Ethereum price is in a consolidative phase as it hovers below a crucial resistance level. While a quick move to the upside to collect liquidity is likely, traders should not confuse this for a bullish directional bias.
Ethereum price to undo its recovery gains
Ethereum price crashed 33% between November 8 and 10 as the FTX exchange collapsed due to the alleged misappropriation of funds. This bearish move created a local bottom at $1,073, allowing buyers to step in and purchase ETH at a discount, resulting in a 25% recovery rally.
After failing to overcome $1,340, the midpoint of the $1,073 to $1,607 range, Ethereum price retraced and kick-started its consolidation. This range tightening created two lower highs and three equal lows. When these swing points are connected using trend lines, it reveals a descending triangle setup.
This Ethereum price formation forecasts a 9% downswing to $1,073, obtained by measuring the distance between the first swing high and swing low to the breakout point at $1,191. Therefore, the trigger for traders is a flip of the aforementioned support level.
Additionally, the Relative Strength Index shows that the momentum is predominantly bearish as it hovers below the 50-level. Another rejection at this hurdle will further strengthen the outlook described above.
In some cases, however, Ethereum price might breach the triangle to the upside to collect the buy-stop liquidity resting above the two distinctive lower lows. This move is termed a fakeout and could trap impatient traders on the wrong side.
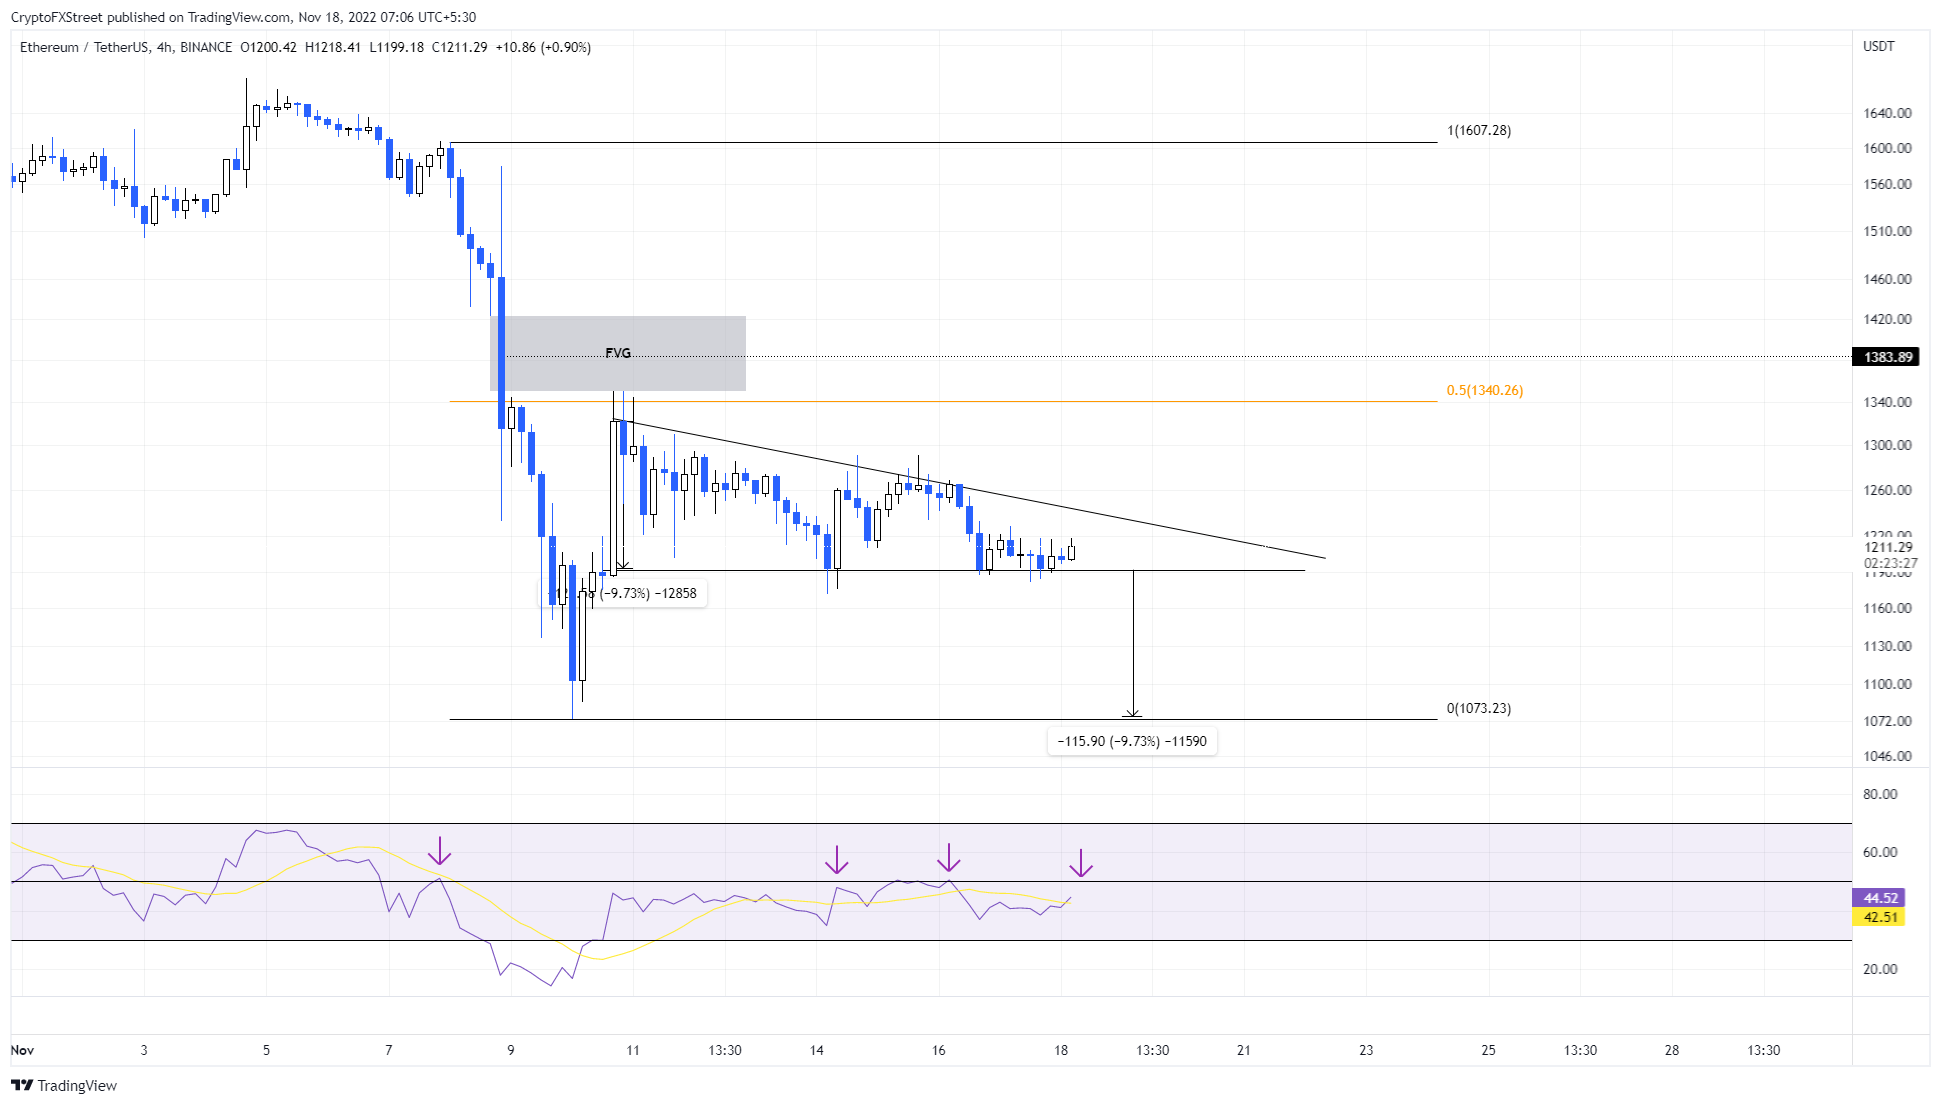
ETHUSDT 4-hour chart
While things are looking up for Ethereum price, investors need to be cautious of a prolonged fakeout. If sellers do not take control and knock ETH lower, it could result in an upward momentum build-up, allowing buyers to seize control.
In such a case, if Ethereum price produces a four-hour candlestick close above $1,340, it will invalidate the bearish thesis for the smart contract token. Such a development will open further upside for ETH to balance the Fair Value Gap inefficiency and tag the $1,383 level.
Author

Akash Girimath
FXStreet
Akash Girimath is a Mechanical Engineer interested in the chaos of the financial markets. Trying to make sense of this convoluted yet fascinating space, he switched his engineering job to become a crypto reporter and analyst.


