Ethereum price tops $2,400 as 25% of ETH supply is staked and ETF applicants amend filings


  • Ethereum price hit a local peak of $2,444 on Thursday as ETF applicants’ Ark Invest and 21Shares amend Spot ETH filing. 
  • 25% of Ethereum supply is staked, reducing ETH tokens in circulation and the selling pressure on the altcoin.
  • ETH price rally to 2024 peak above $2,700 is likely in its uptrend. 

Ethereum price rallied on Thursday as two major events catalyzed ETH gains. Ethereum’s Exchange Traded Fund (ETF) applicants, Ark and 21Shares amended their Spot ETH filings, sparking anticipation of an approval. 

ETH price climbed to $2,444 on Thursday, as ETH continues to form higher highs and higher lows. 

Also read: XRP Price faces threat of fall below $0.50 as XRPLedger AMM amendment is uncertain

Two catalysts drive gains in Ethereum price

Supply of Ethereum tokens staked hit the 25% mark on Thursday, according to Lido Finance’s recent tweet. This is a key milestone for Ethereum as the staked supply represents Ether that has been removed from circulation. This typically reduces the selling pressure on Ethereum. 

The second catalyst is the amendment of Ethereum ETF filings by applicants’ Ark Invest and 21Shares. This has sparked anticipation of Ethereum ETF approval. Just as Spot Bitcoin ETF approval by the SEC ushered in a large volume of capital inflow from traders, Ethereum holders expect a similar occurrence post an ETH ETF approval.    

Ethereum price could rally to 2024 high

Ethereum price is in an upward trend starting January 23. The altcoin formed higher highs and higher lows, as seen in the price chart below. The closest resistance is the 50% Fibonacci Retracement level of the decline between January 12 and 23, at $2,440.09. 

If Ethereum price breaks past resistance at $2,440.09, the next target is the $2,500 level. The 2024 high of $2,715.29 represents nearly a 9% rally from $2,500. 

Ethereum’s Relative Strength Index (RSI) is 58.07, sustaining above the neutral level. The Moving Average Convergence/ Divergence (MACD) indicator shows green bars, suggesting there is momentum that supports ETH price gains. 

ETH

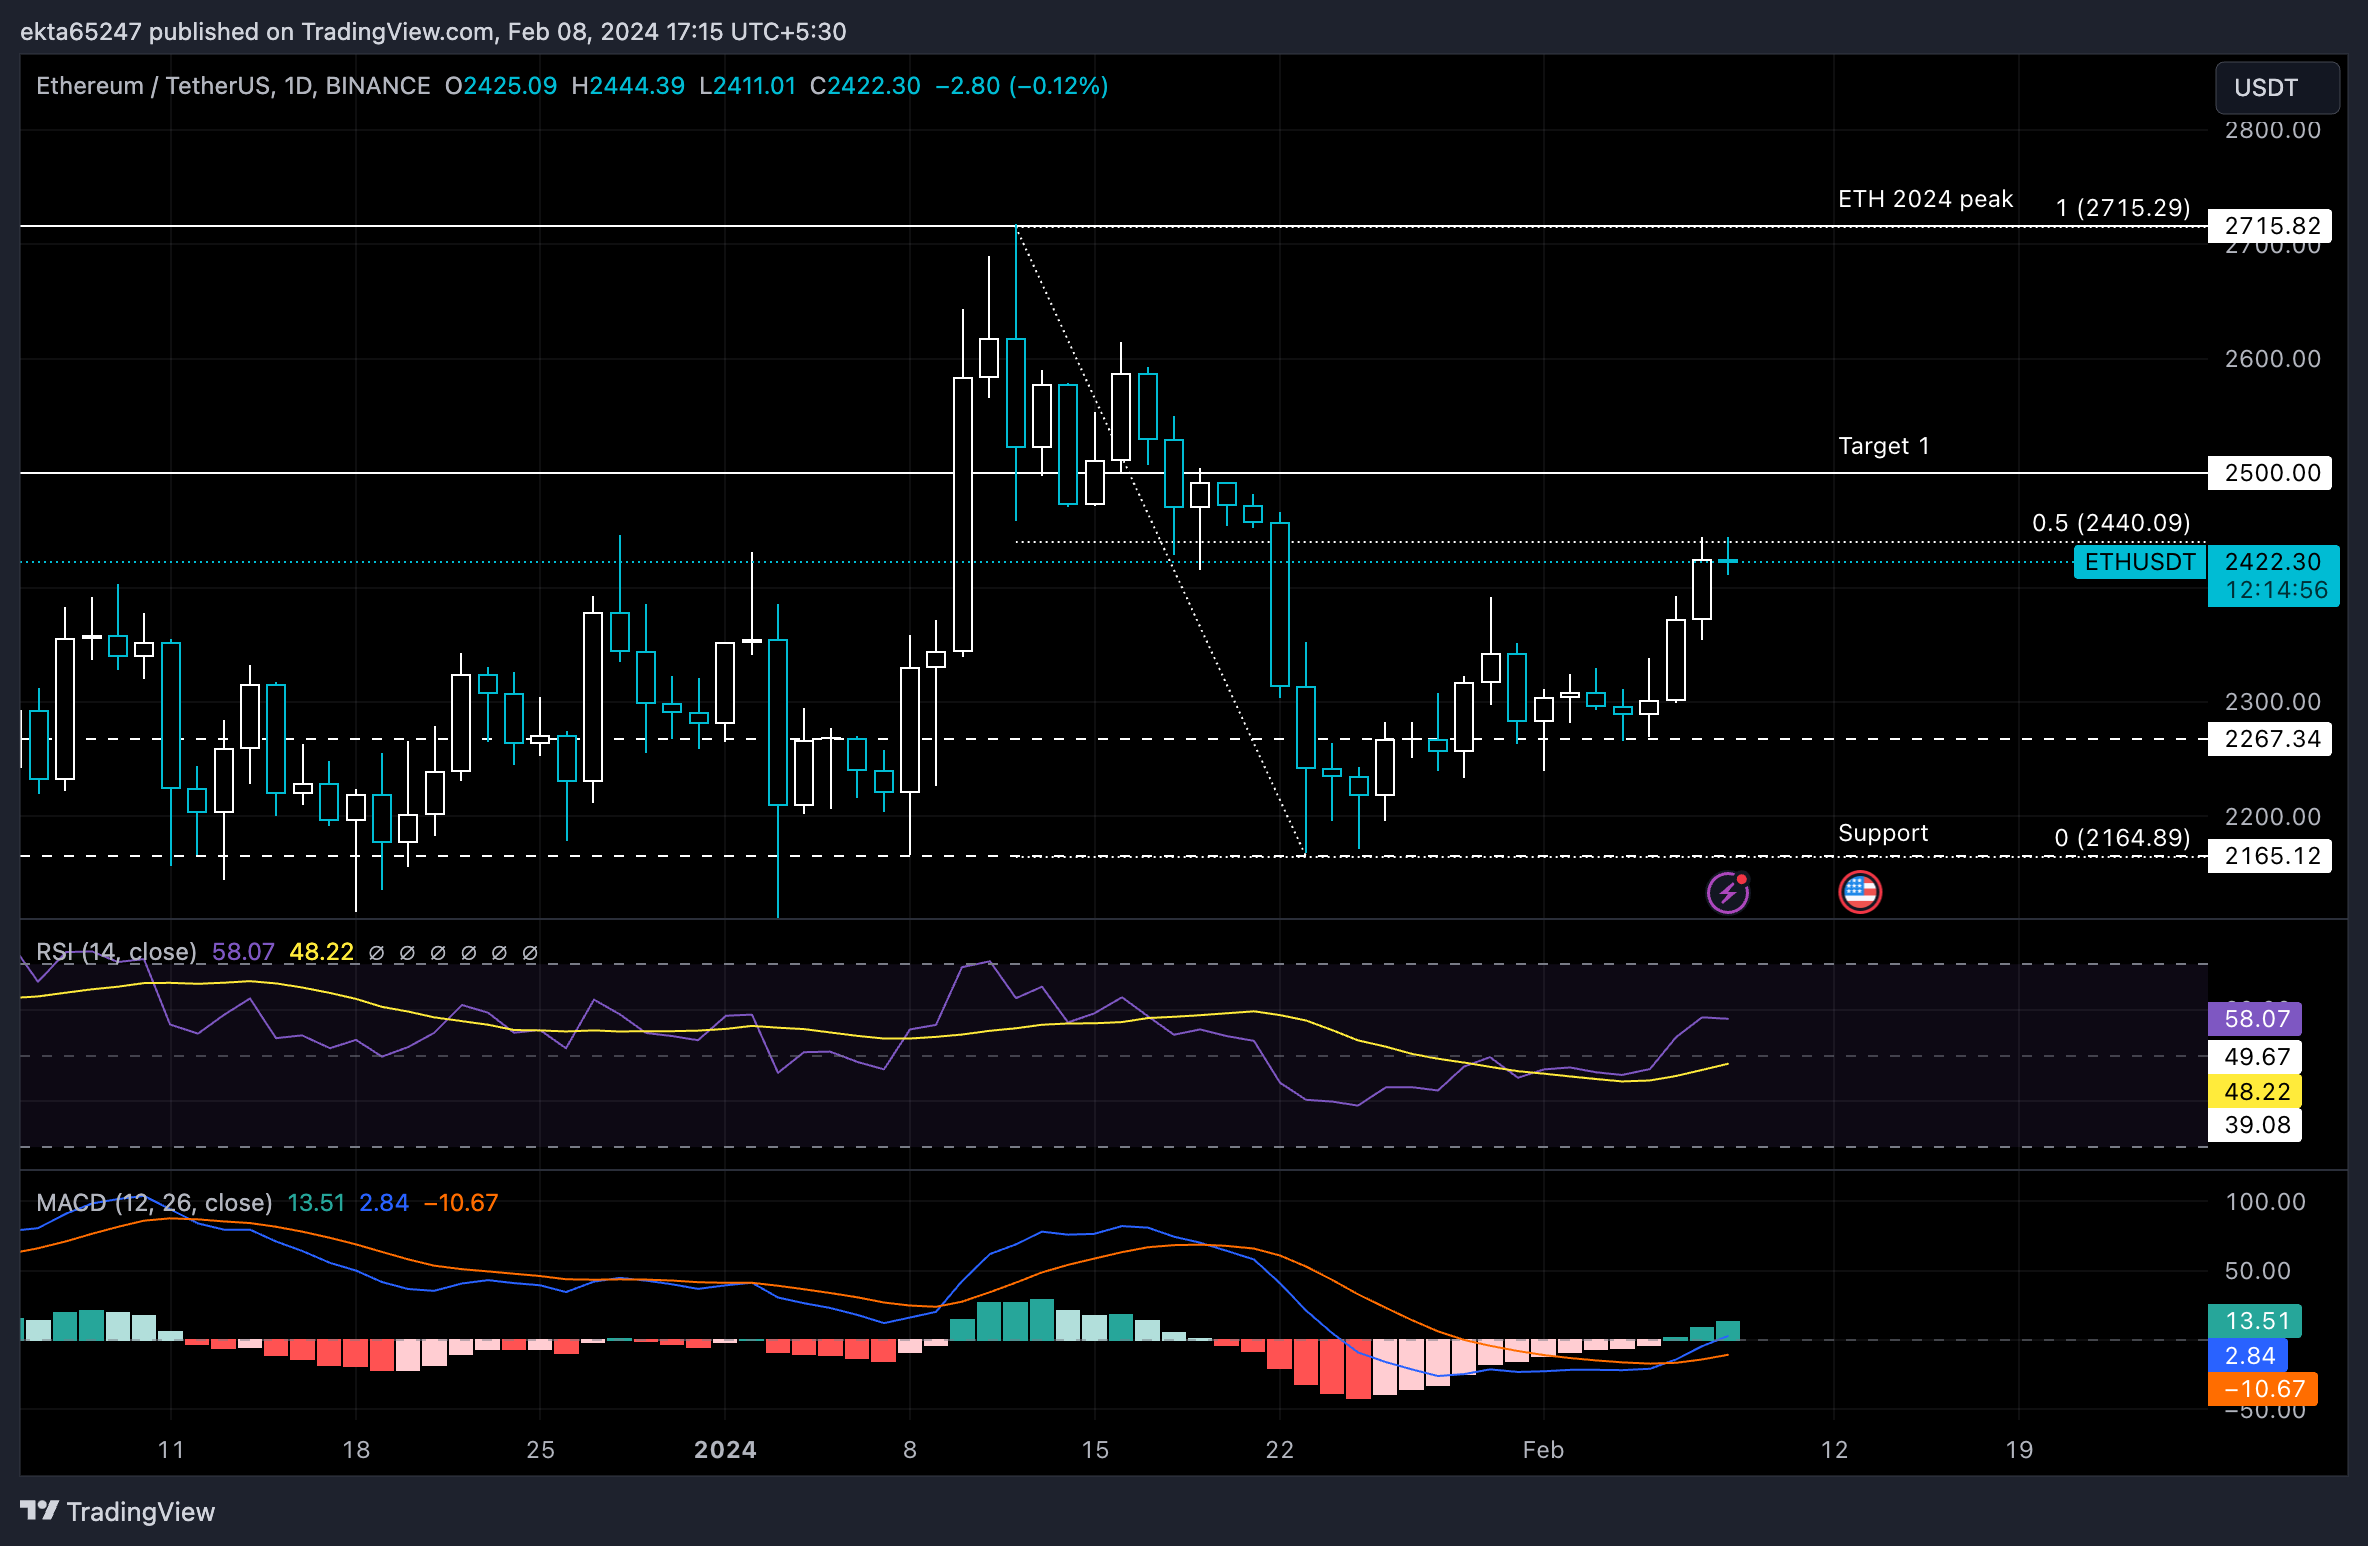
ETH/USDT 1-day chart 

A daily candlestick close below the support at $2,267 could invalidate the bullish thesis for Ethereum. ETH price could then find support at the January 23 low of $2,164.89. 


Information on these pages contains forward-looking statements that involve risks and uncertainties. Markets and instruments profiled on this page are for informational purposes only and should not in any way come across as a recommendation to buy or sell in these assets. You should do your own thorough research before making any investment decisions. FXStreet does not in any way guarantee that this information is free from mistakes, errors, or material misstatements. It also does not guarantee that this information is of a timely nature. Investing in Open Markets involves a great deal of risk, including the loss of all or a portion of your investment, as well as emotional distress. All risks, losses and costs associated with investing, including total loss of principal, are your responsibility. The views and opinions expressed in this article are those of the authors and do not necessarily reflect the official policy or position of FXStreet nor its advertisers. The author will not be held responsible for information that is found at the end of links posted on this page.

If not otherwise explicitly mentioned in the body of the article, at the time of writing, the author has no position in any stock mentioned in this article and no business relationship with any company mentioned. The author has not received compensation for writing this article, other than from FXStreet.

FXStreet and the author do not provide personalized recommendations. The author makes no representations as to the accuracy, completeness, or suitability of this information. FXStreet and the author will not be liable for any errors, omissions or any losses, injuries or damages arising from this information and its display or use. Errors and omissions excepted.

The author and FXStreet are not registered investment advisors and nothing in this article is intended to be investment advice.

Join Telegram

Recommended content


Recommended Content

Editors’ Picks

Could Worldcoin price shoot up 45% ahead of OpenAI’s live stream on Monday?

Could Worldcoin price shoot up 45% ahead of OpenAI’s live stream on Monday?

Worldcoin has formed a double bottom around a key support level, suggesting a potential accumulation. If the OpenAI’s Monday live stream has a positive impact on Artificial Intelligence field, it could positively impact WLD and other AI-based tokens. 

More Worldcoin News

Here’s what needs to happen for The Graph price to revisit $0.422

Here’s what needs to happen for The Graph price to revisit $0.422

The Graph price trades inside the $0.192 to $0.494 range. Investors need to wait for GRT to overcome $0.343 before being bullish on GRT. If successful, GRT could rally 50% and revisit the $0.422 hurdle. A decisive daily candlestick close below $0.192 will invalidate the bullish thesis.

More The Graph News

SingularityNET price could bounce 30% if AGIX can hold this level

SingularityNET price could bounce 30% if AGIX can hold this level

SingularityNET price has been consolidating around the bottom of the $0.903 to $1.475 range for nearly a month. With some AI-tokens showing signs of revival, AGIX needs to be enalyzed for potential breakout opportunities like Arkham (ARKM).

More SingularityNET News

Arkham price primed for a recovery rally ahead of OpenAI’s announcement

Arkham price primed for a recovery rally ahead of OpenAI’s announcement

Arkham price eyes a potential reversal as it clears key hurdles. ARKM likely to rally 27% if it can overcome $2.74 resistance level. A breakdown of $2.28 wil invalidate the bullish thesis for the AI-based token.

More Arkham News

Bitcoin: Why BTC is close to a bottom

Bitcoin: Why BTC is close to a bottom

Bitcoin (BTC) price efforts of a recovery this week have been countered by selling pressure during the onset of the American session. However, the downside potential appears to have been capped. 

Read full analysis

BTC

ETH

XRP