Ethereum price readies for lift-off towards $4900 amid bull flag breakout
- ETH price is breaking higher once again, eyes fresh lifetime highs.
- A bull flag confirmation on the 4H chart calls for a fresh rally.
- RSI points south while above 50.00, keeping the upside intact.

Ethereum, the no.2 widely traded cryptocurrency, is picking up fresh bids above $4300, reversing a temporary reversal seen on Saturday.
ETH price saw a brief correction from all-time highs of $4462 a day before, although the bulls are back in the game amid the ongoing optimism surrounding the Ethereum 2.0 Altair Beacon Chain update, which was done successfully with 98.7% of nodes upgraded as of early Friday.
At the press time, ETH/USD is trading virtually unchanged on the day, defending the $4300 mark, having recorded a fifth straight weekly advance.
Ethereum price eyes additional upside, with a bull flag in play
Ethereum’s four-hour chart shows that the price has broken to the upside from a bull flag formation.
The recent rally that kicked in on Friday followed by the pullback carved out the bullish continuation pattern on the said time frame.
A four-hourly candlestick closing above the falling trendline resistance at $4337 yielded the upside breakout, opening doors for an explosive rally towards the pattern target of $4910.
However, ETH bulls will need to clear the all-time highs of $4462 first to unleash the additional upside.
The next relevant topside barrier is aligned at the $4600 round figure.
The Relative Strength Index (RSI) has eased from higher levels but remains well within the bullish zone, keeping ETH buyers cheerful.
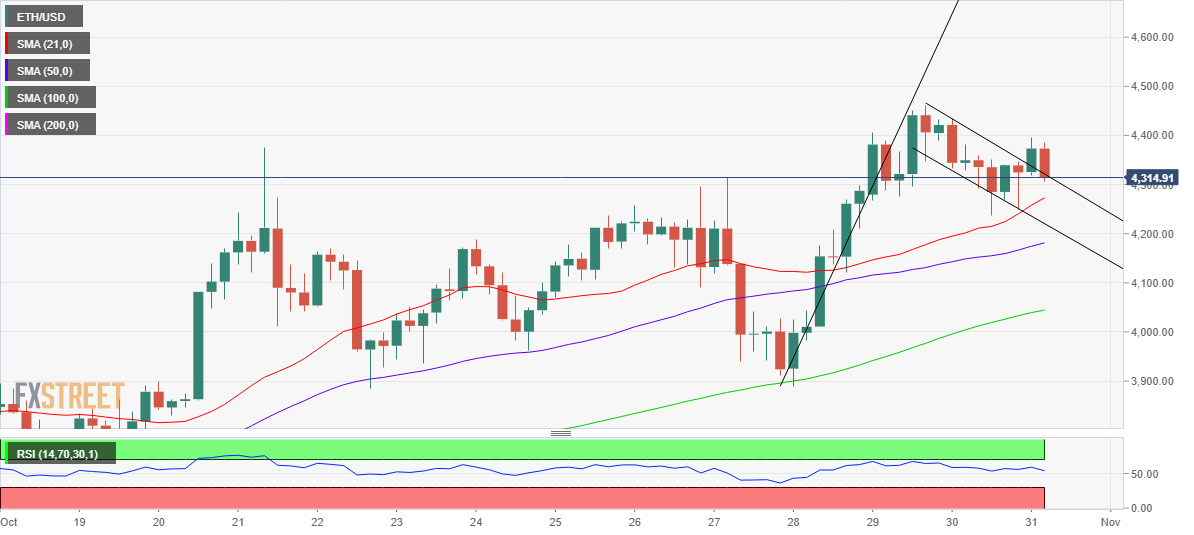
ETH/USD: Four-hour chart
Should the corrective downside gather steam in the upcoming sessions, then the pattern resistance now support at $4321 will cave in on a sustained basis.
ETH bears will then aim for the upward-pointing 21-Simple Moving Average (SMA) at $4273 if the selling pressure intensifies.
The last line of defense for ETH bulls is the falling trendline (pattern) support at $4220. Acceptance below the latter will invalidate the bull flat formation, triggering a fresh downtrend in ETH price.
Author

Dhwani Mehta
FXStreet
Residing in Mumbai (India), Dhwani is a Senior Analyst and Manager of the Asian session at FXStreet. She has over 10 years of experience in analyzing and covering the global financial markets, with specialization in Forex and commodities markets.



