Ethereum price pushes higher, ETH targeting $3,500
- Ethereum price continues to hold support against the $2,500 level.
- Two primary resistance levels ahead could halt the current rally.
- Downside pressure remains, but its severity is decreasing.

Ethereum price continues to increase, extending the current rally to nine days and a gain of nearly 30% from the January 24 lows. However, near-term resistance may cause an end to the current rally.
Ethereum price faces a combination of Fibonacci and Ichimoku resistance levels
Ethereum price is currently testing the daily Kijun-Sen ($2,790) as its primary, near-term resistance. Yesterday's close was right on top of this level, and it was the first test of the Kijun-Sen as resistance since January 5 and only the second test since the Ideal Bearish Ichimoku Breakout occurred on December 27, 2021.
The two red arrows on the chart image below show an arrow pointing down on the candlestick chart and an arrow pointing up on the Composite Index. These arrows highlight a discrepancy between the price chart and the oscillator: price action has lower highs, but the oscillator has higher highs. This is a condition known as hidden bearish divergence.
Hidden bearish divergence is only valid if an instrument is in a broader downtrend – which Ethereum price is. Hidden bearish divergence is a warning sign that the pullback higher is likely to reverse with price action continuing its prior downtrend. The probability of this divergence playing out in favor of the bears' increases if it appears while price is against a strong resistance zone.
Even if Ethereum price were to move above and close above the Kijun-Sen, the 50% Fibonacci retracement would likely act as a source of resistance. However, the 50% Fibonacci retracement might be a fake-out for short-sellers. The Volume Profile in 2021 and 2022 shows that the $2,900 value area is extremely thin. In other words, Ethereum price should have an easy time moving through and above the $2,900 zone. If that occurs, the road to test $3,500 is wide open.
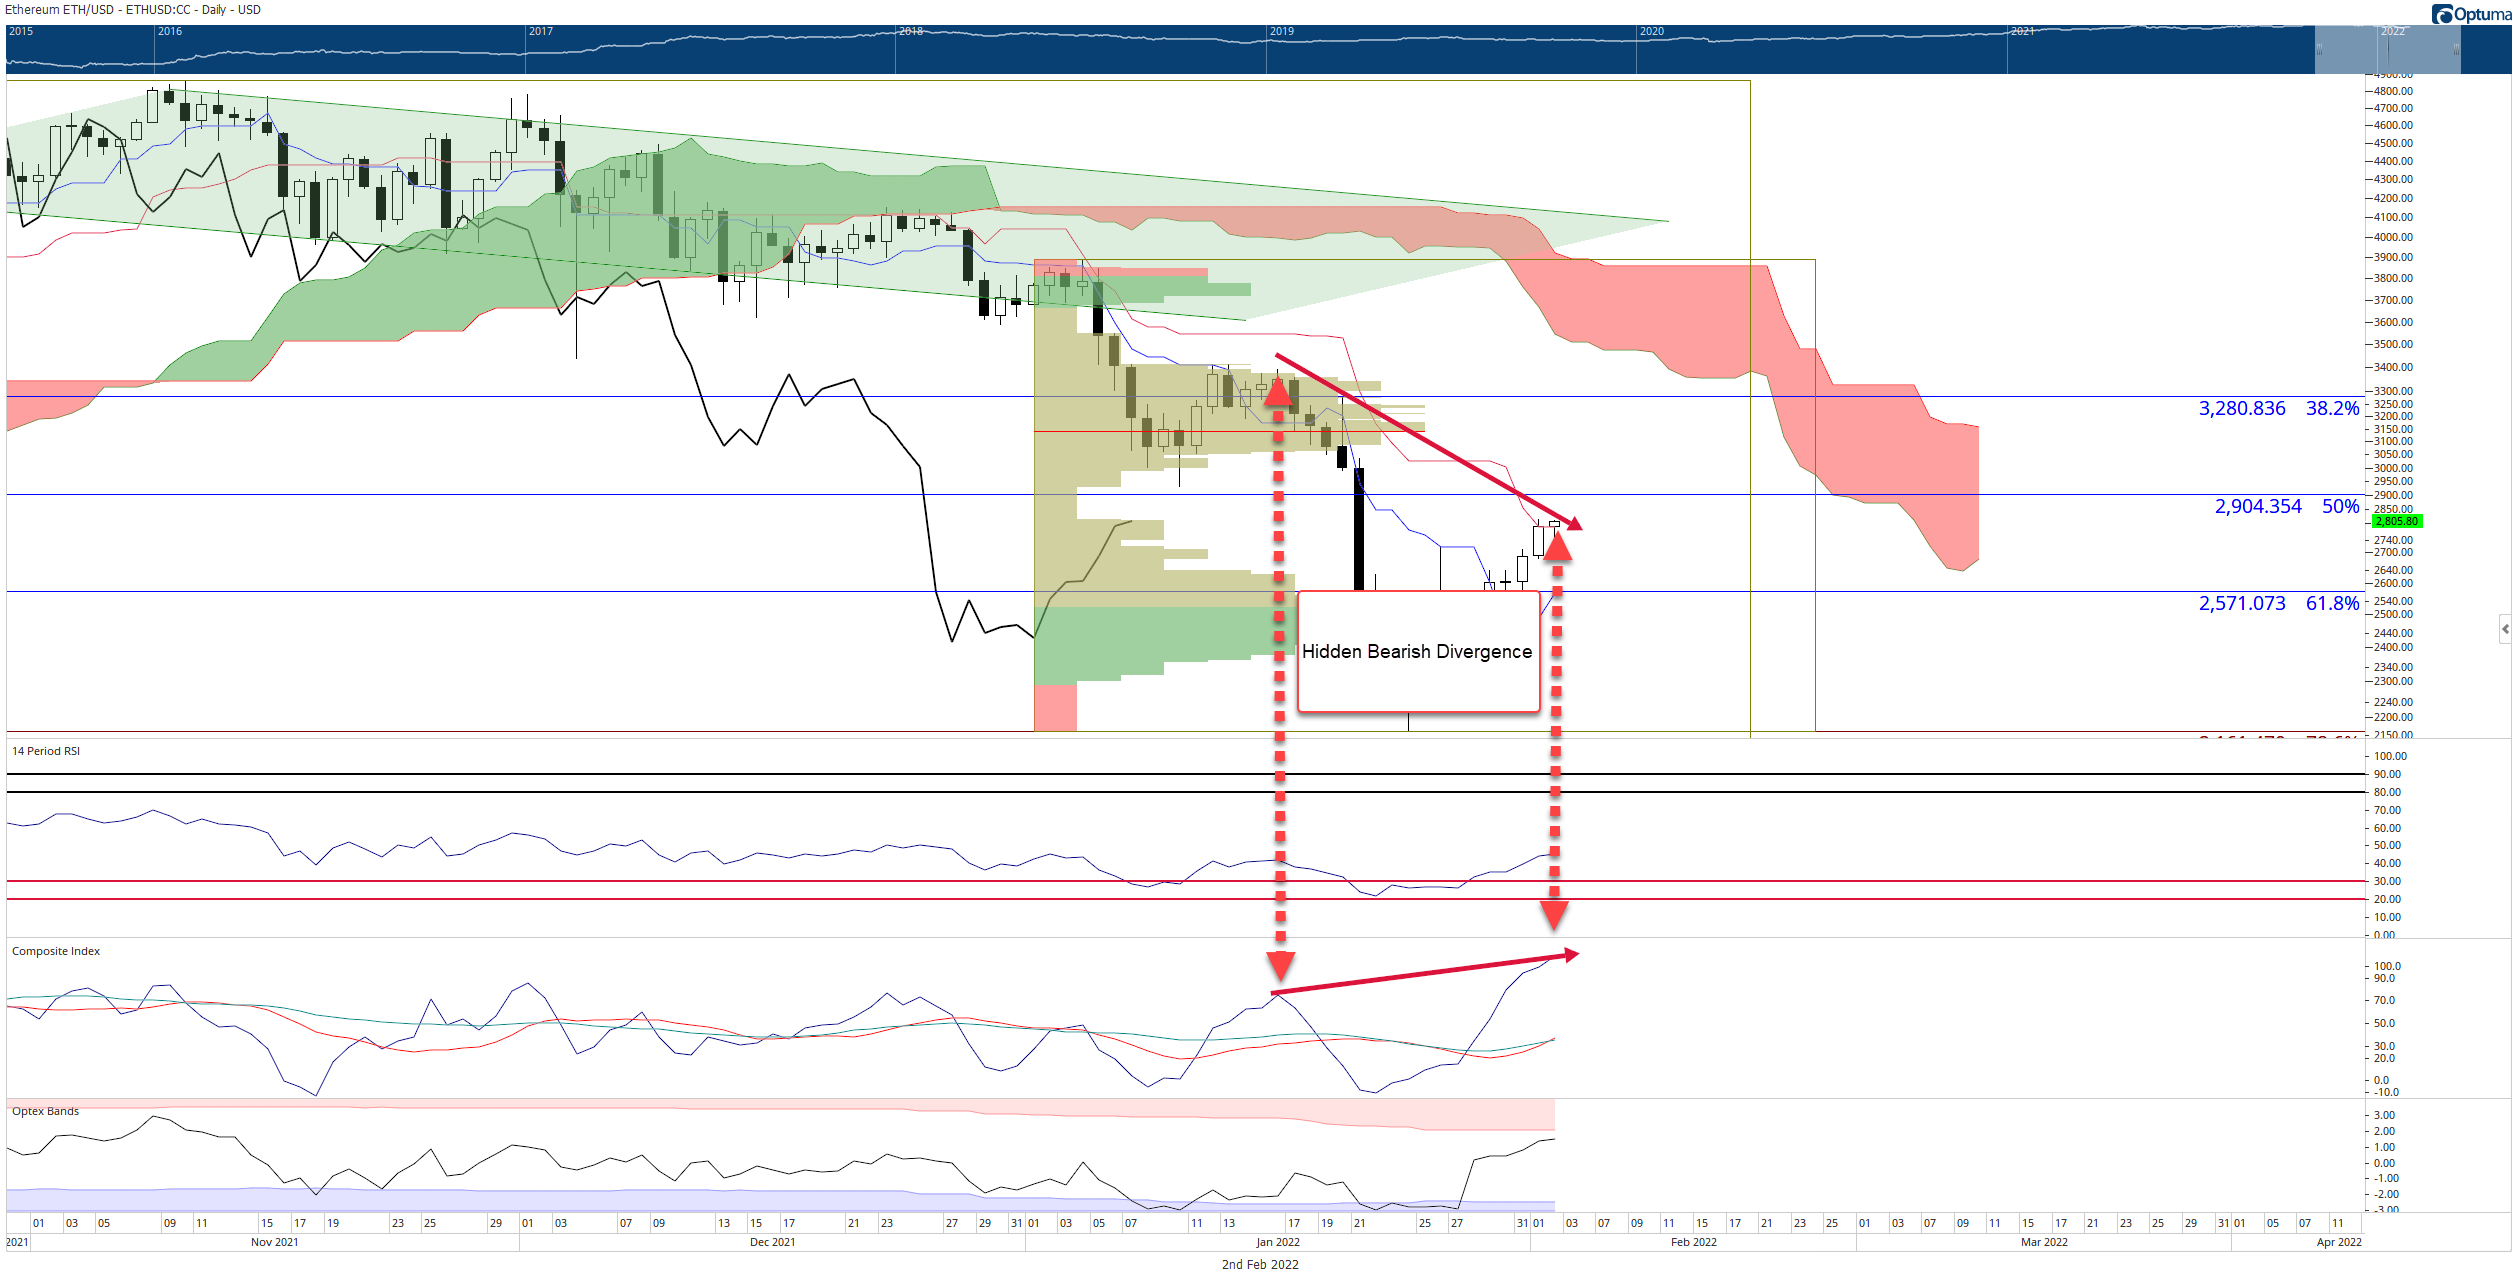
ETH/USD Daily Ichimoku Kinko Hyo Chart
Downside risks remain but would require substantial selling pressure. However, significant support exists at $2,500 where the daily Tenkan-Sen and 61.8% Fibonacci retracement exist.
A close below $2,500 would invalidate any near-term bullish outlook and likely trigger a move to test the $1,800 value area.
Author

Jonathan Morgan
Independent Analyst
Jonathan has been working as an Independent future, forex, and cryptocurrency trader and analyst for 8 years. He also has been writing for the past 5 years.


