Ethereum price faces further danger as bearish pattern projects 16% decline
- Ethereum price could be at risk of another 16% fall projected by the governing technical pattern.
- The lower boundary of the prevailing chart pattern may act as reliable support for ETH at $2,477.
- However, Ethereum could tumble toward $2,100 if the token slices below the critical foothold.

Ethereum price is not out of the woods yet as the second-largest cryptocurrency by market capitalization has formed a cautious outlook. The prevailing chart pattern projects a 16% drop if the token slices below $2,477.
Ethereum price continues to look bearish
Ethereum price has formed a rising wedge pattern on the 4-hour chart, indicating that ETH could be at risk of a 16% decline toward $2,100 if it slices below the lower boundary of the governing technical pattern at $2,477.
ETH is grasping for support at the 21 four-hour Simple Moving Average (SMA) at $2,510. Ethereum price will discover reliable support at the 50 four-hour SMA at $2,477, which intersects with the lower boundary of the prevailing chart pattern.
If Ethereum price slices below the aforementioned line of defense, then ETH would be vulnerable to further decline, a 16% fall toward $2,100.
If selling pressure continues to increase, the January 27 low at $2,349 may act as a foothold for Ethereum price, then at the January 25 low at $2,221.
Ethereum price may tumble further toward the pessimistic target at $2,100 if the bulls refuse to step in.
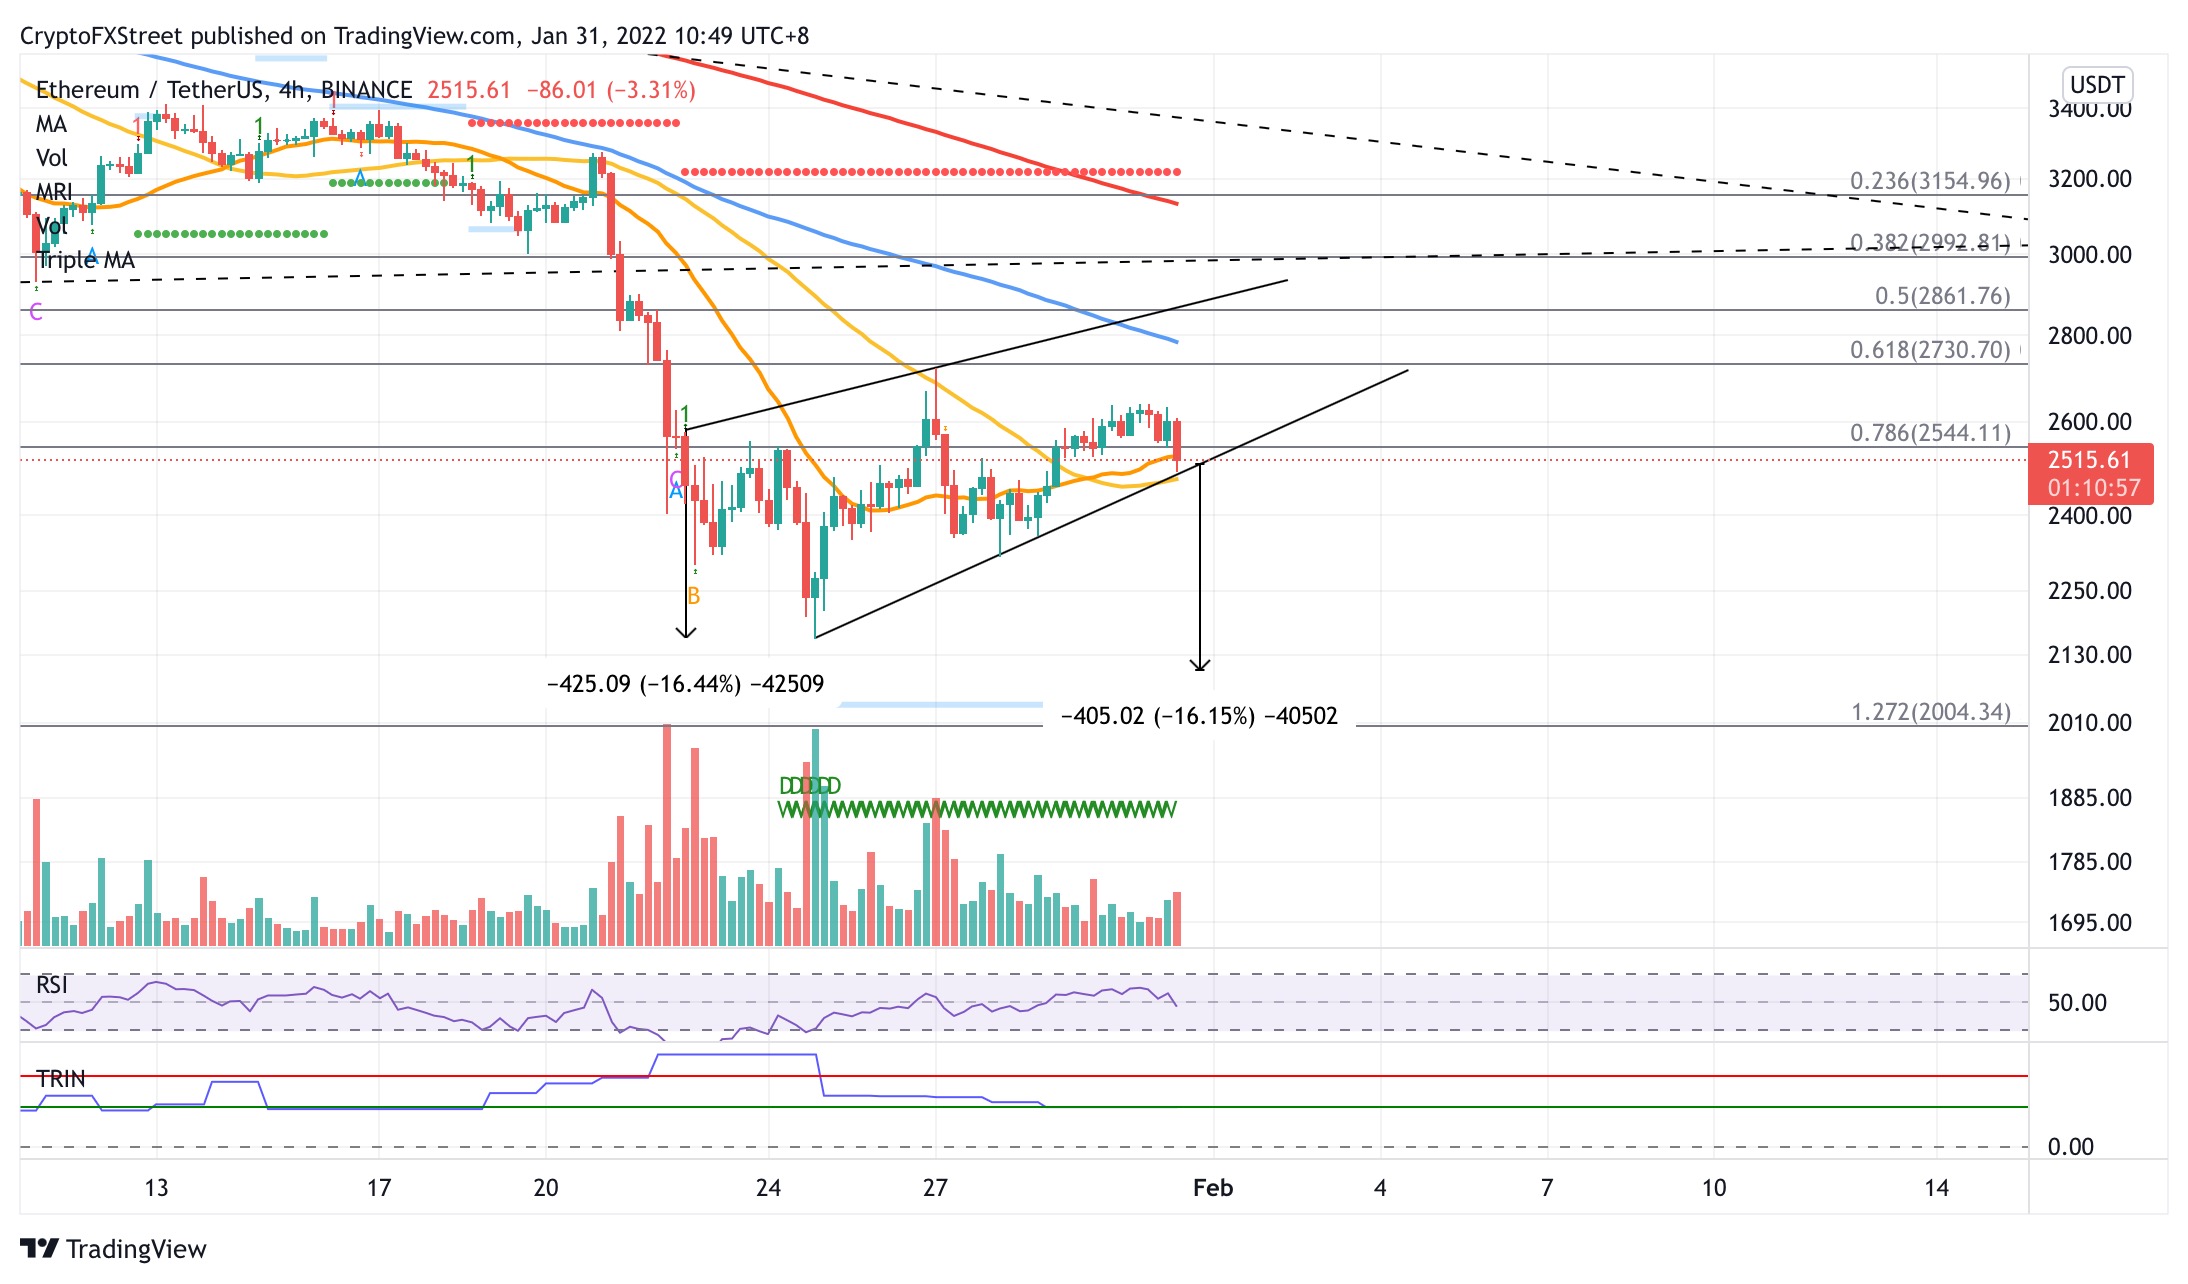
ETH/USDT 4-hour chart
However, if a spike in buy order occurs, Ethereum price may face the first line of resistance at the 78.6% Fibonacci retracement level at $2,544, then at the 61.8% Fibonacci retracement level at $2,730, coinciding with the January 27 high.
Additional obstacles for the bulls may emerge at the 100 four-hour SMA at $2,783, then at the upper boundary of the governing technical pattern at $2,861, intersecting with the 50% retracement level.
Bigger aspirations may target the 38.2% Fibonacci retracement level at $2,992.
Author

Sarah Tran
Independent Analyst
Sarah has closely followed the growth of blockchain technology and its adoption since 2016.