Ethereum Weekly Forecast: ETH bull trap could trigger a crash to $1,750
- Ethereum price displays a short-term bullish outlook after a 9% ascent since January 31.
- Technical and on-chain metrics suggest that this uptrend could be temporary for ETH.
- A daily candlestick close above $3,413 will invalidate the bearish thesis by producing a higher high.

Ethereum price has seen a stabilization of its steep correction around a crucial support level. The resulting rally from the said barrier has pushed ETH close to an overhead barrier, which could get rejected, leading to another down leg.
Ethereum price awaits judgment
Ethereum price shows a pessimistic setup known as a bearish breaker. This technical formation contains two higher highs at $4,025 and $4,868 on September 3, 2021, and November 10, 2021, respectively. A demand zone extending from $2,789 to $3,167 was set up before the second leg-up pushed ETH to its new all-time high at $4,688.
This setup gives the illusion of an uptrend, but things could change drastically when ETH shatters the said demand zone and produces a daily candlestick close below it. This development flips the said zone into a bearish breaker.
Any moves with a bullish intention almost always get rejected at the retest of the bearish breaker. Therefore, the recent uptrend that pushed Ethereum price by 25% from its recent swing low at $2,160 is temporary. A retest of the $2,789 to $3,167 breaker will cause ETH short sellers to trigger another leg down.
In this case, Ethereum price will revisit the weekly support level at $2,324 and, in a dire case, ETH will slide lower and retest the $1,730 support barrier and collect the sell-side liquidity resting below it.
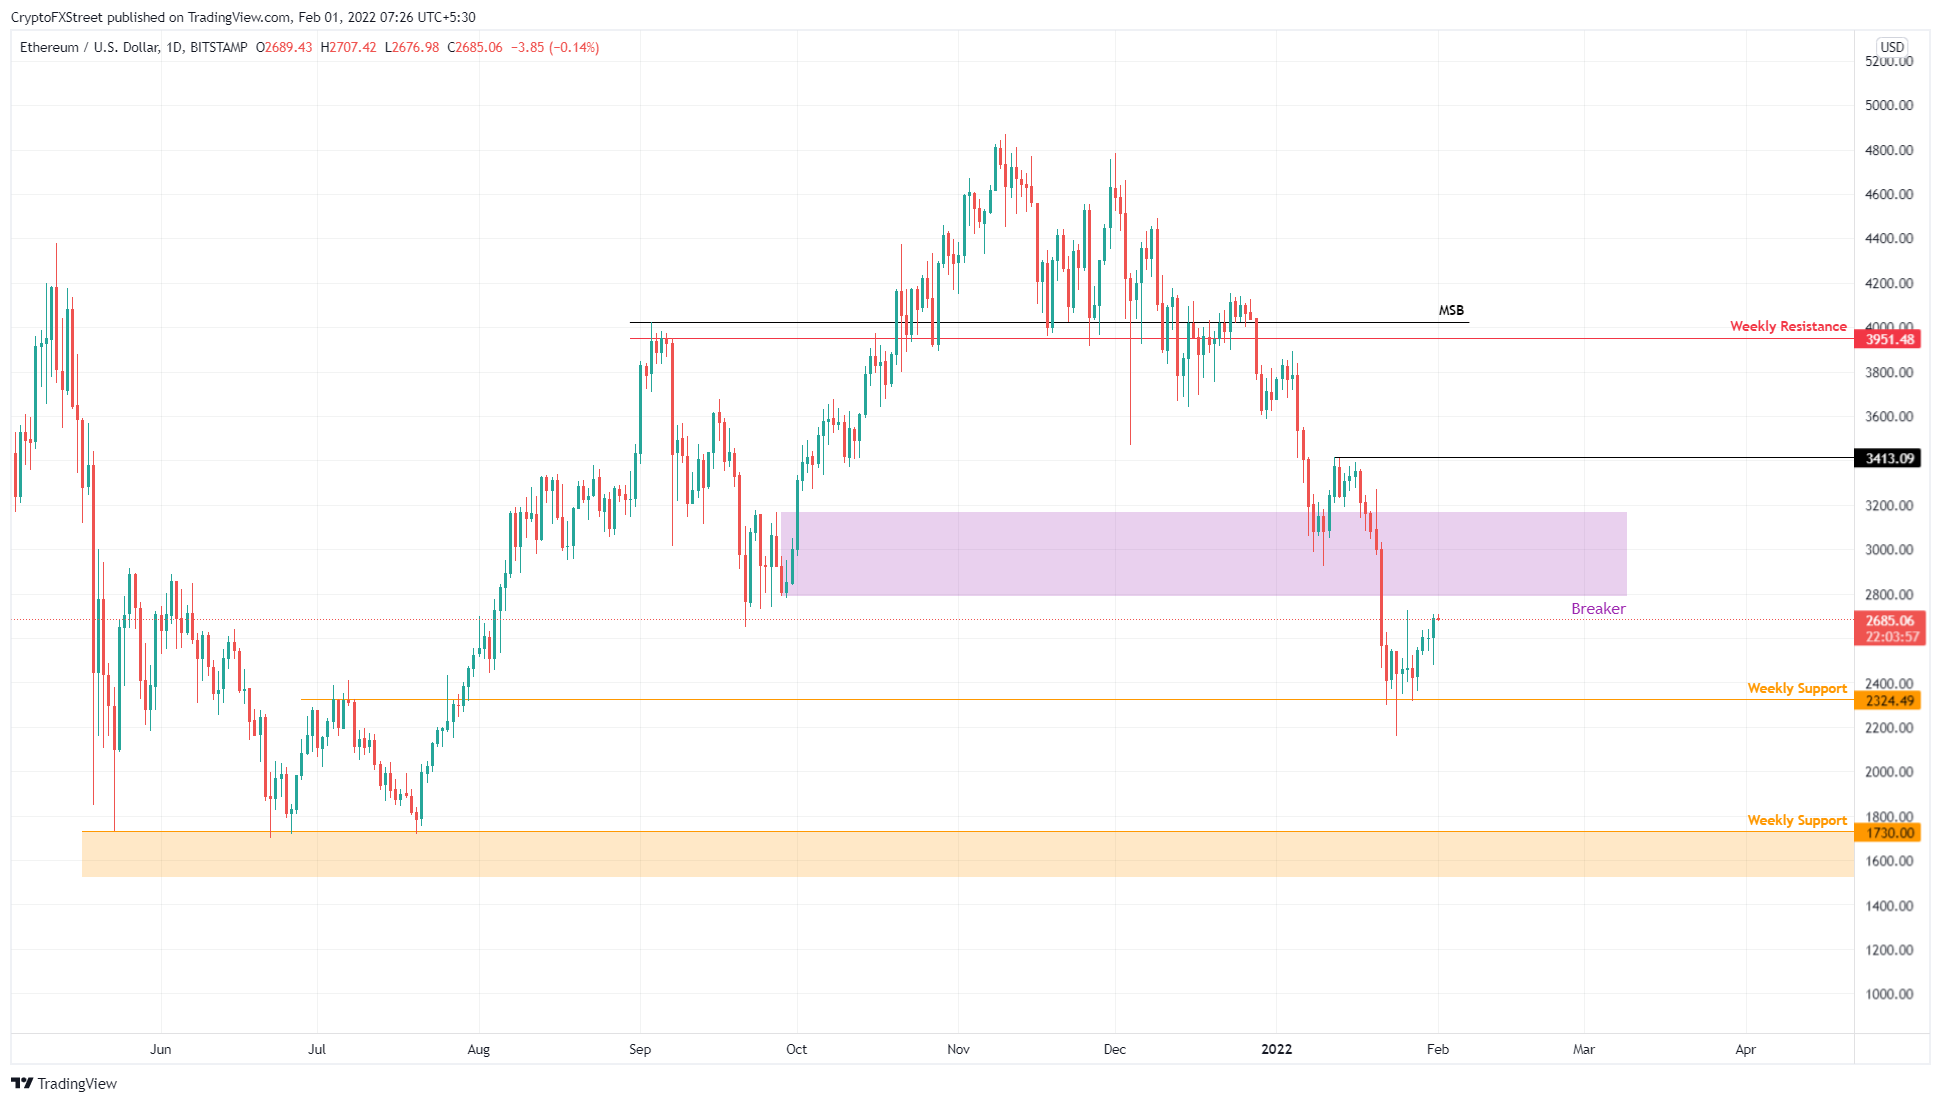
ETH/USD 1-day chart
Supporting this bearish outlook for ETH is the Market Value to Realized Value (MVRV) Z-score. This on-chain metric is used to assess if an asset is overvalued or undervalued and does so by dividing the difference between the market capitalization and realized market capitalization with the standard deviation of the market capitalization.
It takes the MVRV metrics to a new level in determining historical areas of fair value, oversold or overbought. The red band indicates overbought and is typically where the bull runs top and reverse. However, the green value indicates oversold and is where long-term holders tend to accumulate.
The recent crash pushed ETH to have an MVRV Z-score of 0.61, which is just above the green band, suggesting more room for ETH to go lower.
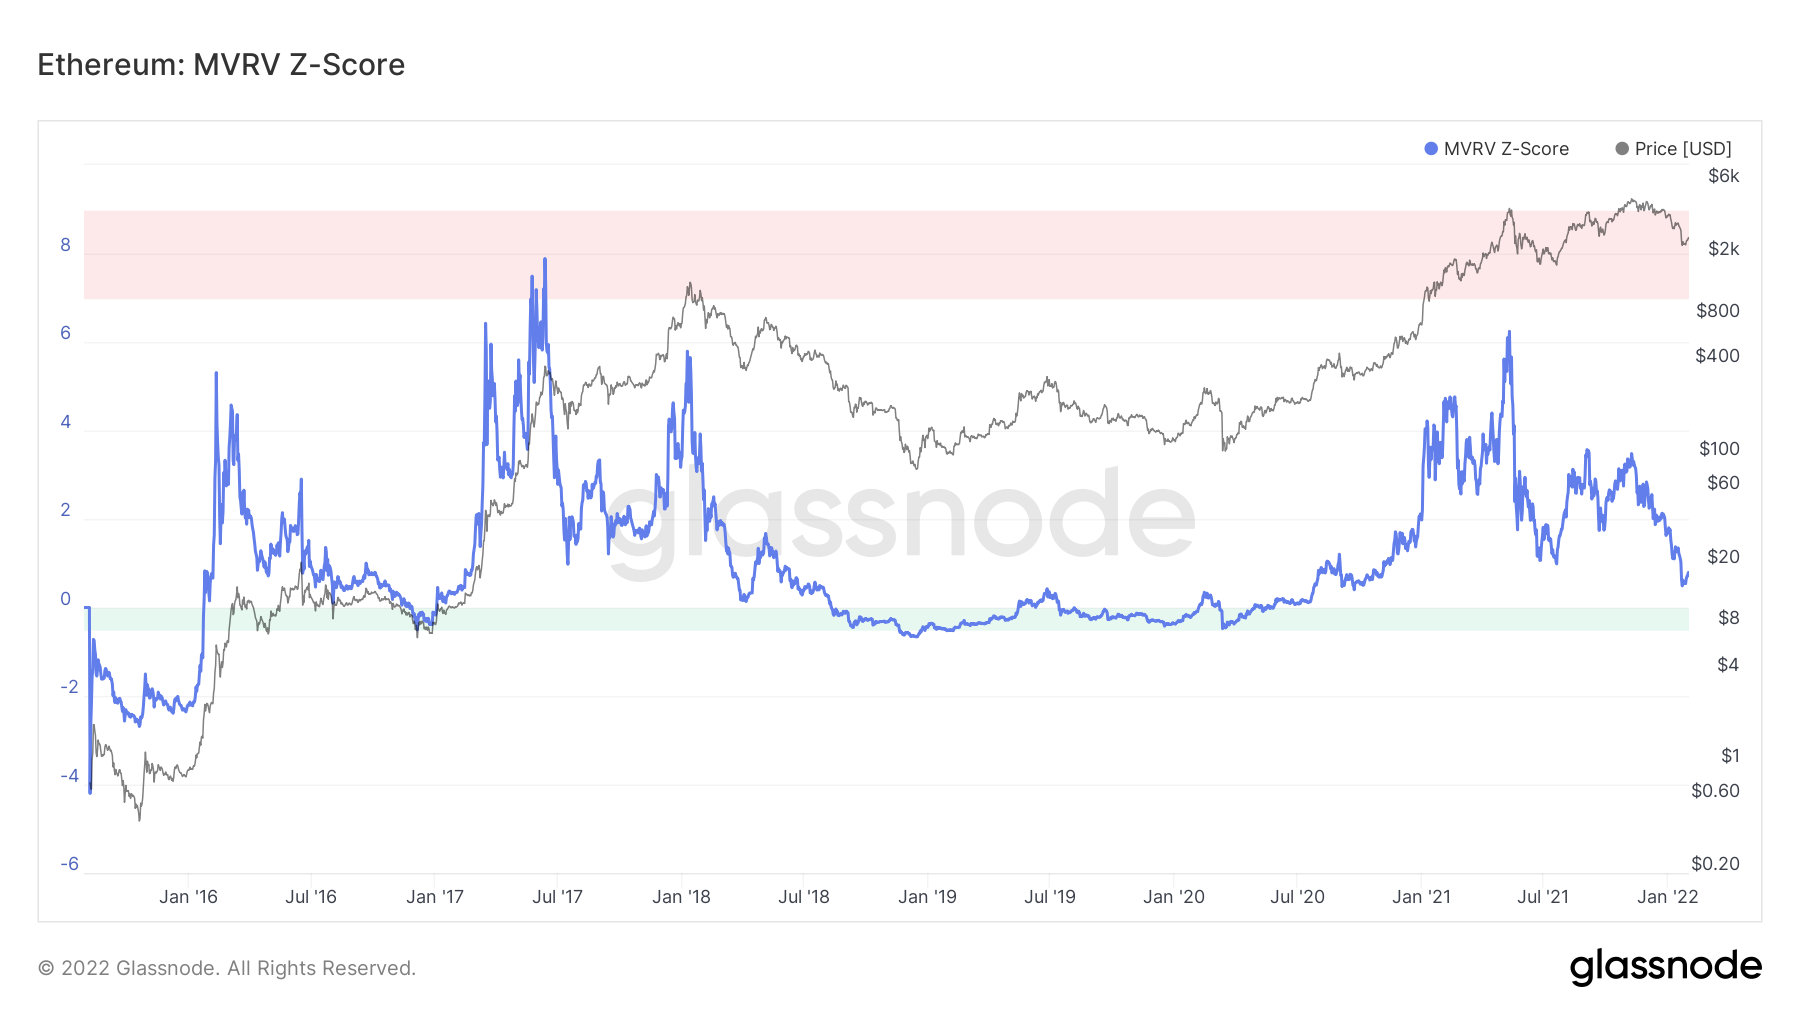
ETH MVRV Z-score
Further depicting the difficulty of a bullish move is IntoTheBlock’s Global In/Out of the Money (GIOM) model. This on-chain index shows that 4.44 million addresses that purchased 15.64 million ETH between $2,699 and $3,250 are “Out of the Money.”
Therefore, any short-term uptrend will face massive selling pressure from investors in this area trying to break even. This fundamental index also explains why ETH is likely to face a sharp rejection and down leg at the retest of the breaker, which coincides with the “Out of the Money” investors’ range.
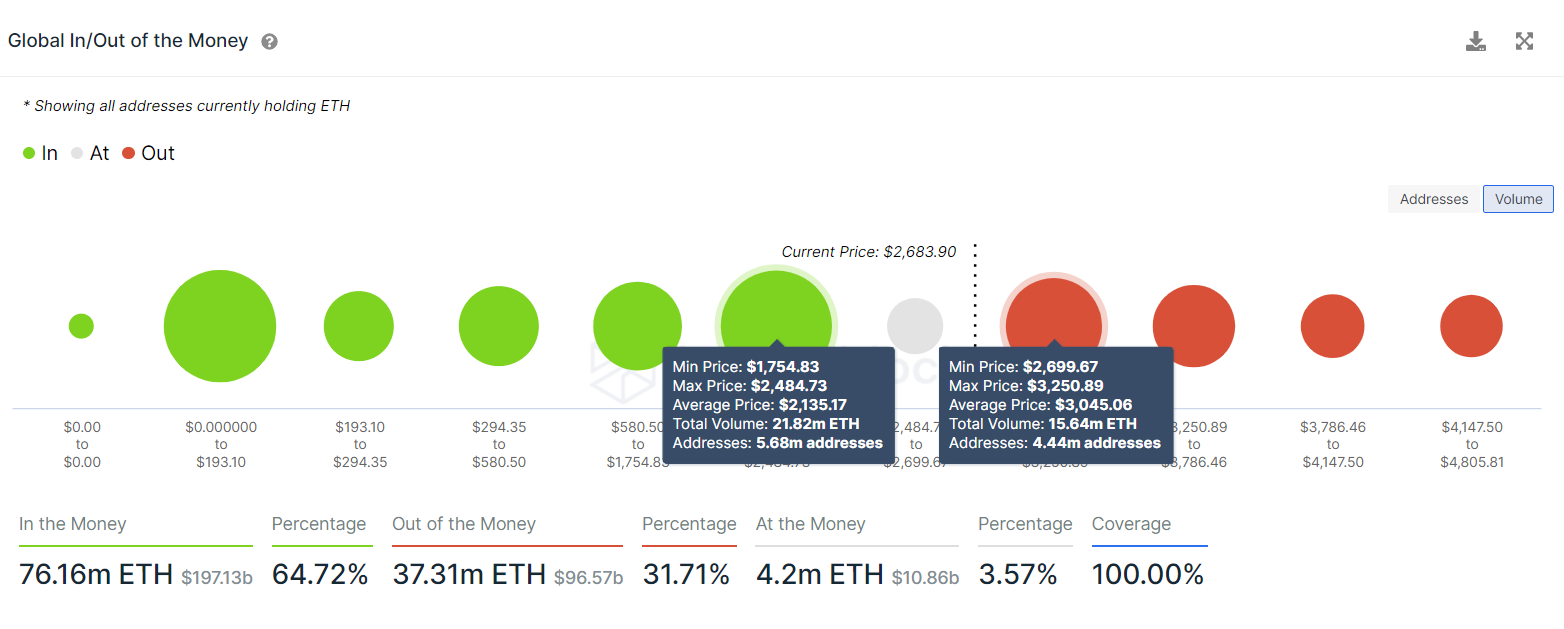
ETH GIOM
While the short-term outlook might seem bullish to the naked eye, the uptrend seems to be a fluke, as seen in the network growth indicator. This indicator tracks the number of new addresses joining the ETH blockchain over the last 24 hours.
Since the crash on January 19, such addresses have dropped from 101,160 to 91,000. This 10% decline indicates that investors are not interested in ETH at the current price levels and that the recent run-up is a fluke.
All these indicators from an on-chain perspective paint the picture that an uptrend seems highly unlikely, both from long-term and short-term perspectives. Interestingly these results line up perfectly with the ones seen via the technical findings, further indicating that rejection at the breaker, ranging from $2,789 to $3,167, is likely.
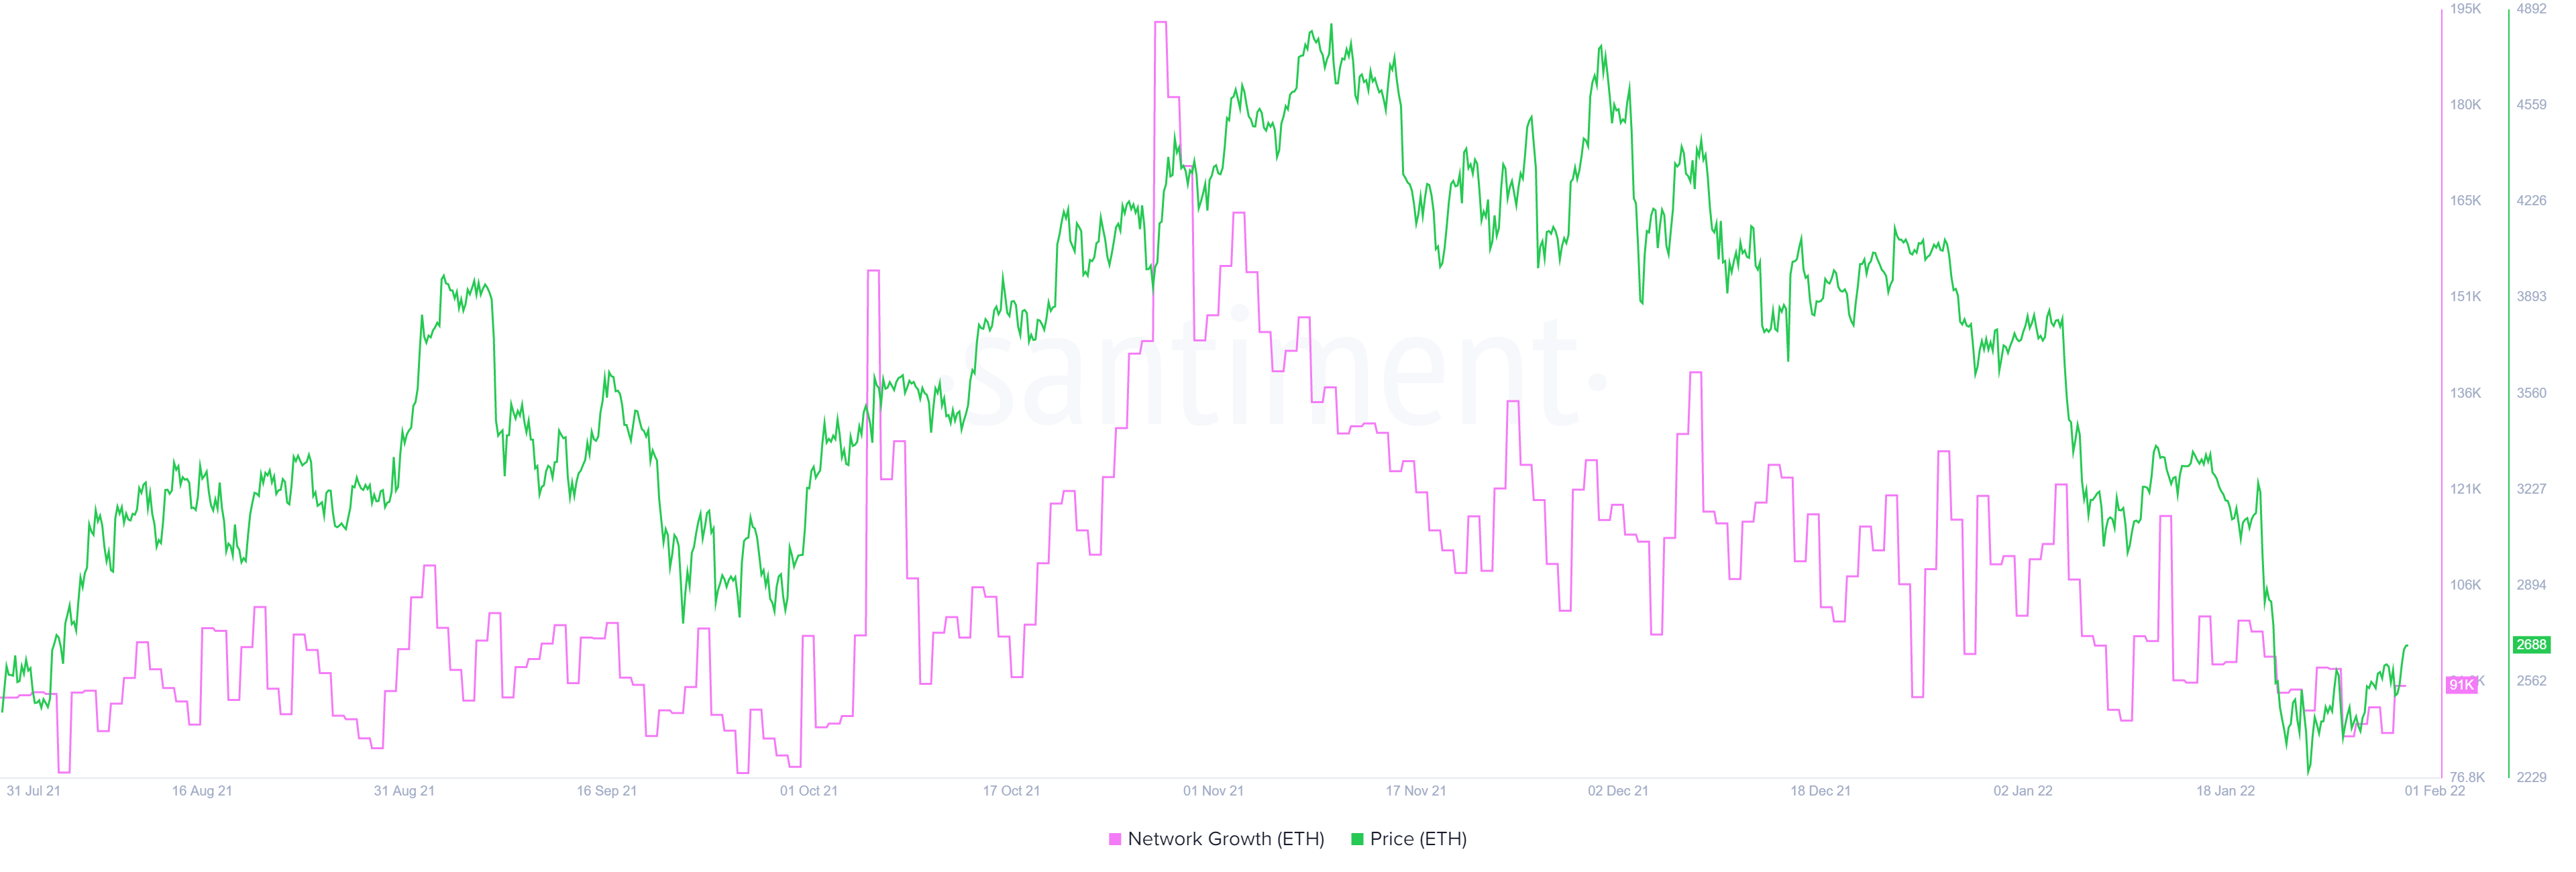
ETH network growth
As bearish as the Ethereum price may seem, the invalidation of this bearish thesis could occur if ETH produces a daily candlestick close above $3,413. This development would produce a higher high, signaling a shift in odds favoring the bulls. Moreover, this move would also overcome the selling pressure from underwater investors, flipping them bullish and adding more to the bullish camp.
In this situation, Ethereum price could continue heading high and retest the weekly resistance barrier at $3,951 or the psychological barrier at $4,000.
Author

Akash Girimath
FXStreet
Akash Girimath is a Mechanical Engineer interested in the chaos of the financial markets. Trying to make sense of this convoluted yet fascinating space, he switched his engineering job to become a crypto reporter and analyst.


