Ethereum price presents traders opportunity to long ETH to $2,000
- Ethereum price has flashed a buy signal in the form of a bullish divergence on the four-hour chart.
- This development forecasts a recovery rally for ETH, similar to what the Bitcoin price is suggesting.
- Invalidation of the bullish thesis will occur if the smart contract tokens flips the $1,649 support floor into a resistance level.

Ethereum price shows a bullish sign which coincides with a similar buy signal seen on Bitcoin price on the four-hour chart. This development could prove to be extremely profitable for investors if they act on ETH.
Also read: Ethereum price pauses its plummet, here’s what ETH holders can expect next
Ethereum price ready to move higher
Ethereum price has been consolidating tightly around the $1,843 support level after a recent 14% crash. This range-bound movement has produced lower lows, while the Relative Strength Index has produced higher lows, signaling a non-conformity termed as ‘bullish divergence.’
The resolution of the aforementioned technical formation forecasts an upswing in Ethereum price. The levels that ETH bulls are likely to target include $1,974, which is the midpoint of the recent nosedive.
Clearing this hurdle will allow Ethereum price to tag the $2,050 hurdle. In total, this move would constitute a 12% gain for traders.
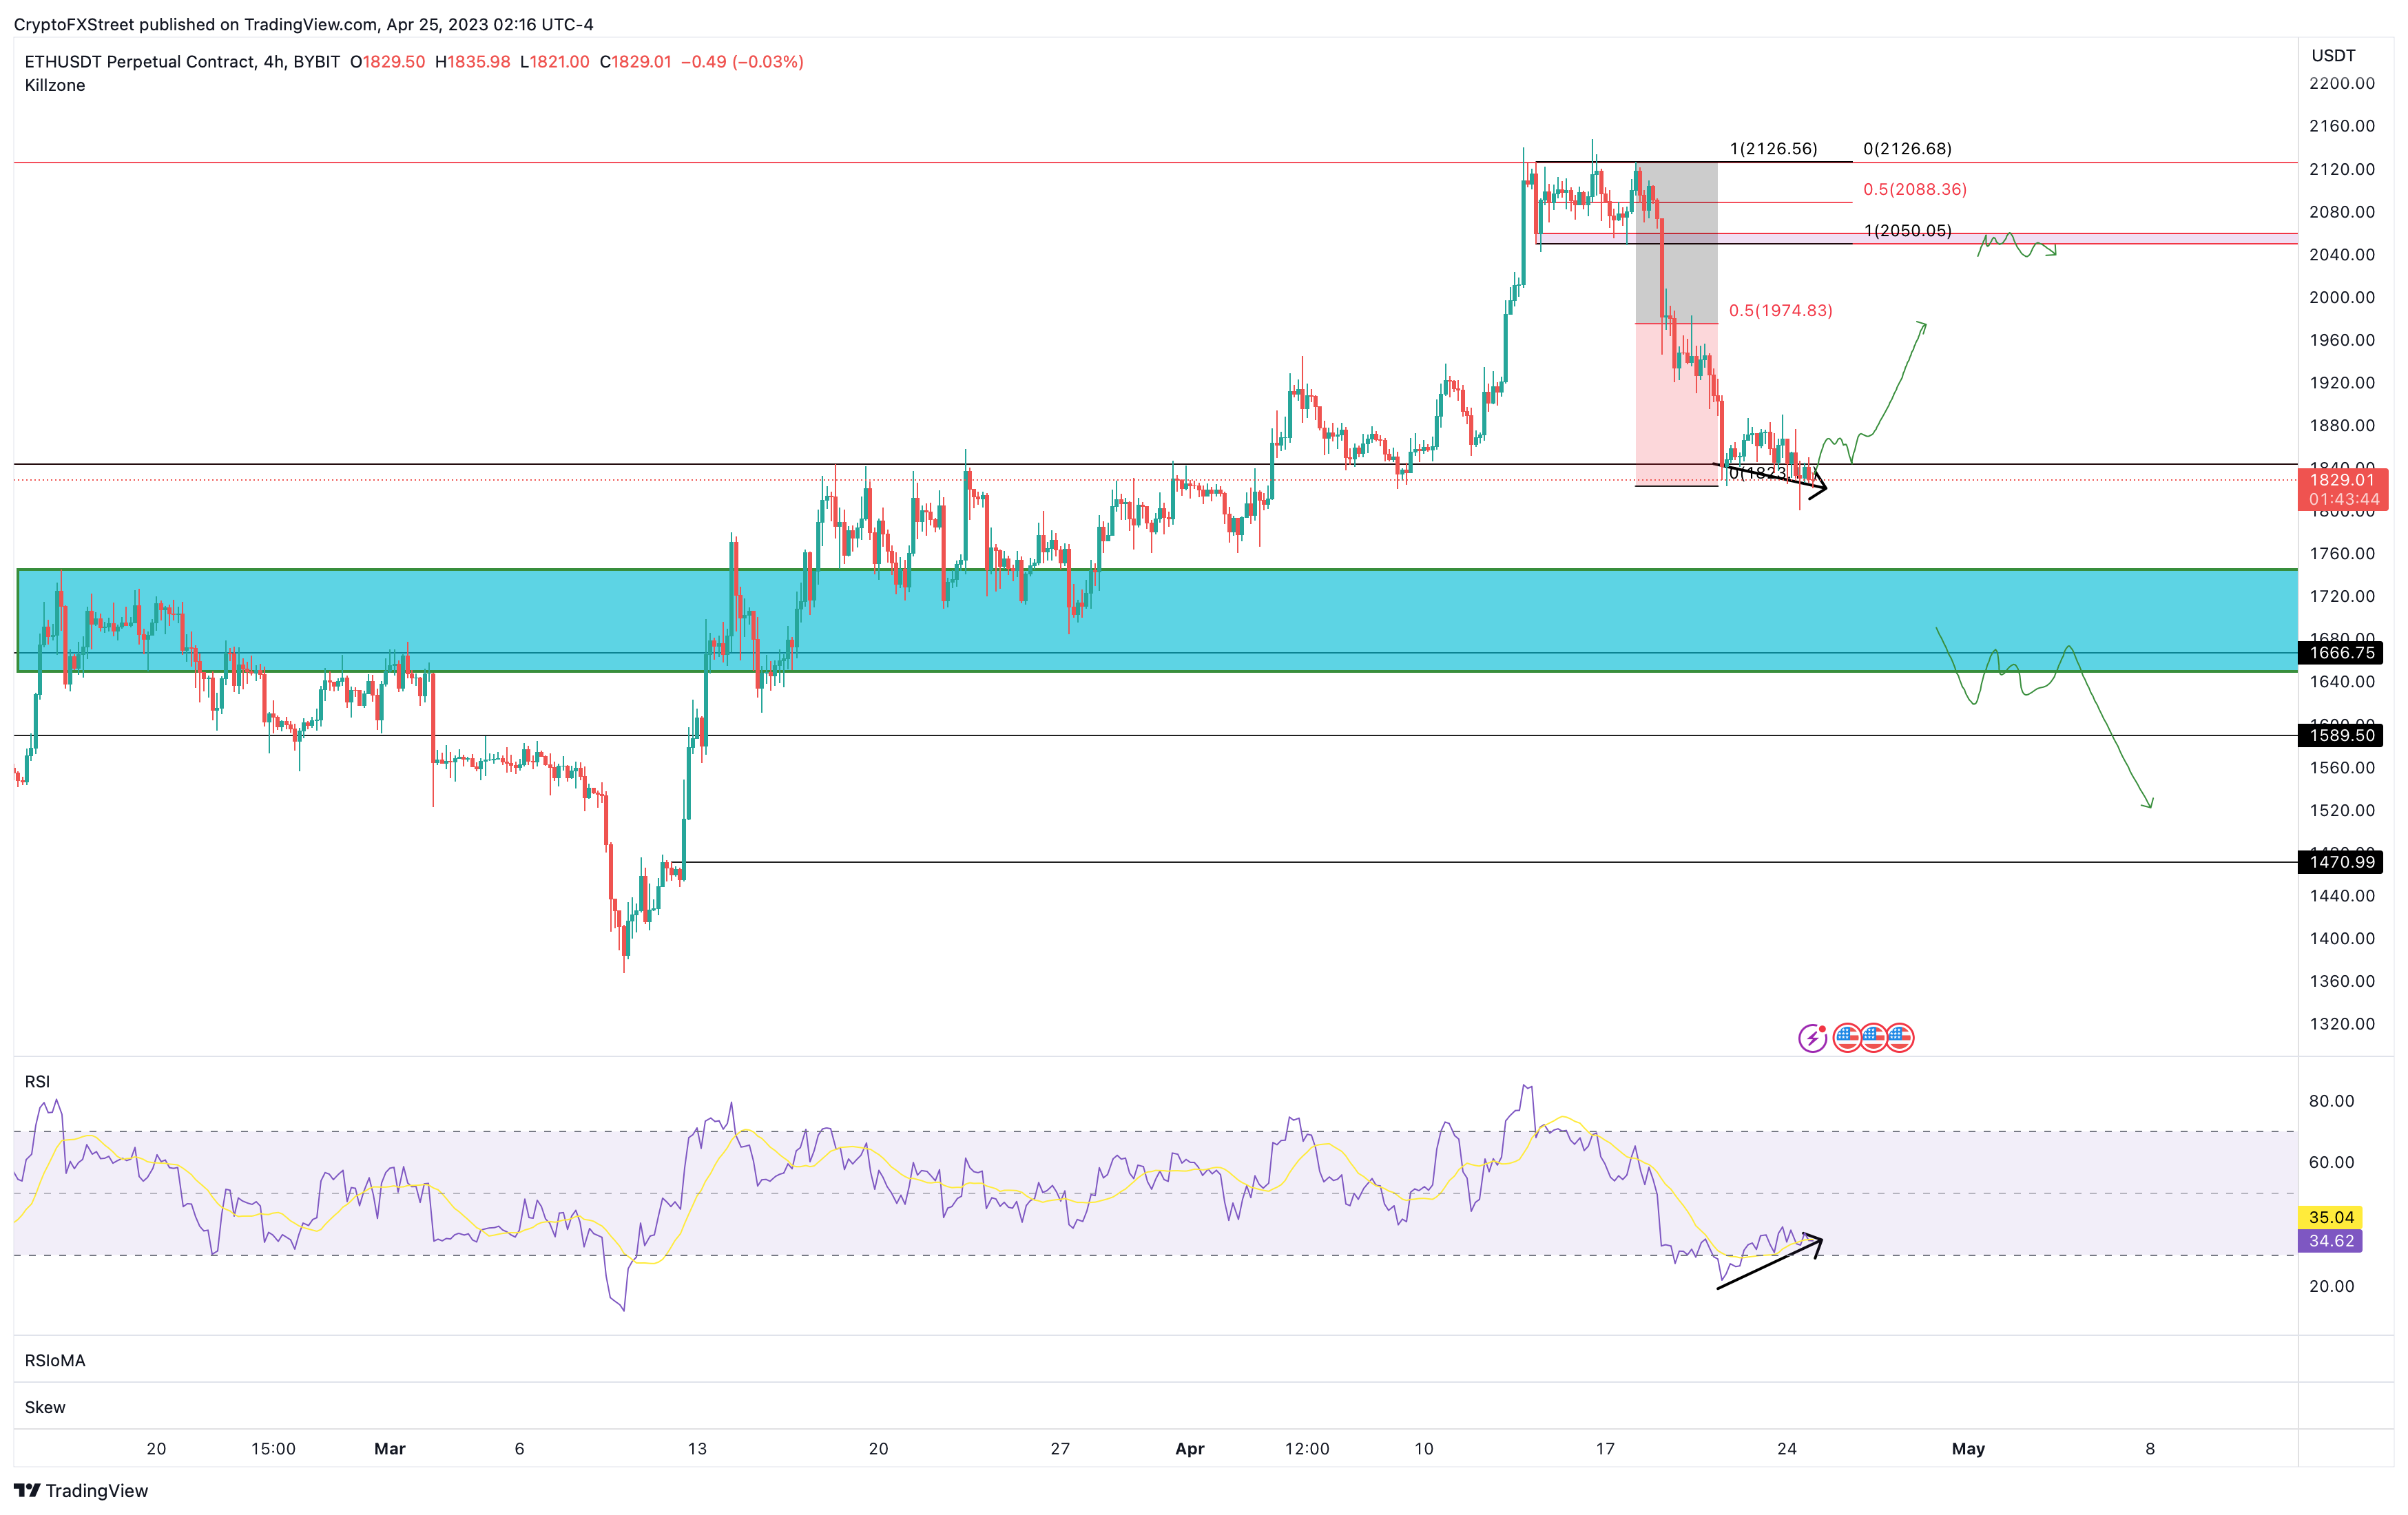
ETH/USDT 4-hour chart
If buyers fail to prop up Ethereum price and sellers takeover instead, it could spell disaster for traders. In such a case, ETH could slide into the bullish breaker, extending from $1,649 to $1,744.
A four-hour candlestick close below $1,744 that flips it into a resistance level will invalidate the bullish thesis for Ethereum price and potentially trigger a correction to $1,589 and $1,470 levels.
Author

Akash Girimath
FXStreet
Akash Girimath is a Mechanical Engineer interested in the chaos of the financial markets. Trying to make sense of this convoluted yet fascinating space, he switched his engineering job to become a crypto reporter and analyst.


