Ethereum Price Prediction: ETH will likely rally to $2,550 following recent bullish breakout
- Ethereum price validated the inverse head and should formation, which is a known bullish pattern.
- On the short-term timeframe, ETH is likely set to witness another 5% growth to meet the target price set by the pattern.
- Price indicators also suggest room for further increases; however, ETH might not be able to breach $2,440.

Ahead of the new year, cryptocurrencies are exhibiting volatility, with no asset following a fixed pattern. This kind of behavior is expected before a major event that can have a considerable impact on the price action, and in the crypto market’s case, it is the upcoming spot Bitcoin ETF approval.
Ethereum price sees another bout of growth
Ethereum price trading at $2,433 recently breached a crucial resistance level marked at $2,334. This price point is key to a historically known bullish pattern called the inverse head and shoulder formation.
The Head and shoulder formation generally signals a bearish outcome, but this pattern does the opposite. Inverse head and shoulders is a reversal pattern that is formed by three consecutive lows along with two intermediate highs. The first and third lows are called shoulders, located approximately at the same level above the second low – the head. Another important line is the one drawn along the intermediate highs – the neckline.
The pattern is completed only when the right shoulder rises above the neckline, suggesting that further rallying will be akin to the height of the head.
In the case of ETH, the height of the head marks a $218 growth, placing the target at $218 above $2,334. This brings the expected rise to $2,551, marking a 9.3% growth. Since, on the 8-hour chart, Ethereum price has already satisfied the pattern with the breach of the neckline, there is room for further growth.
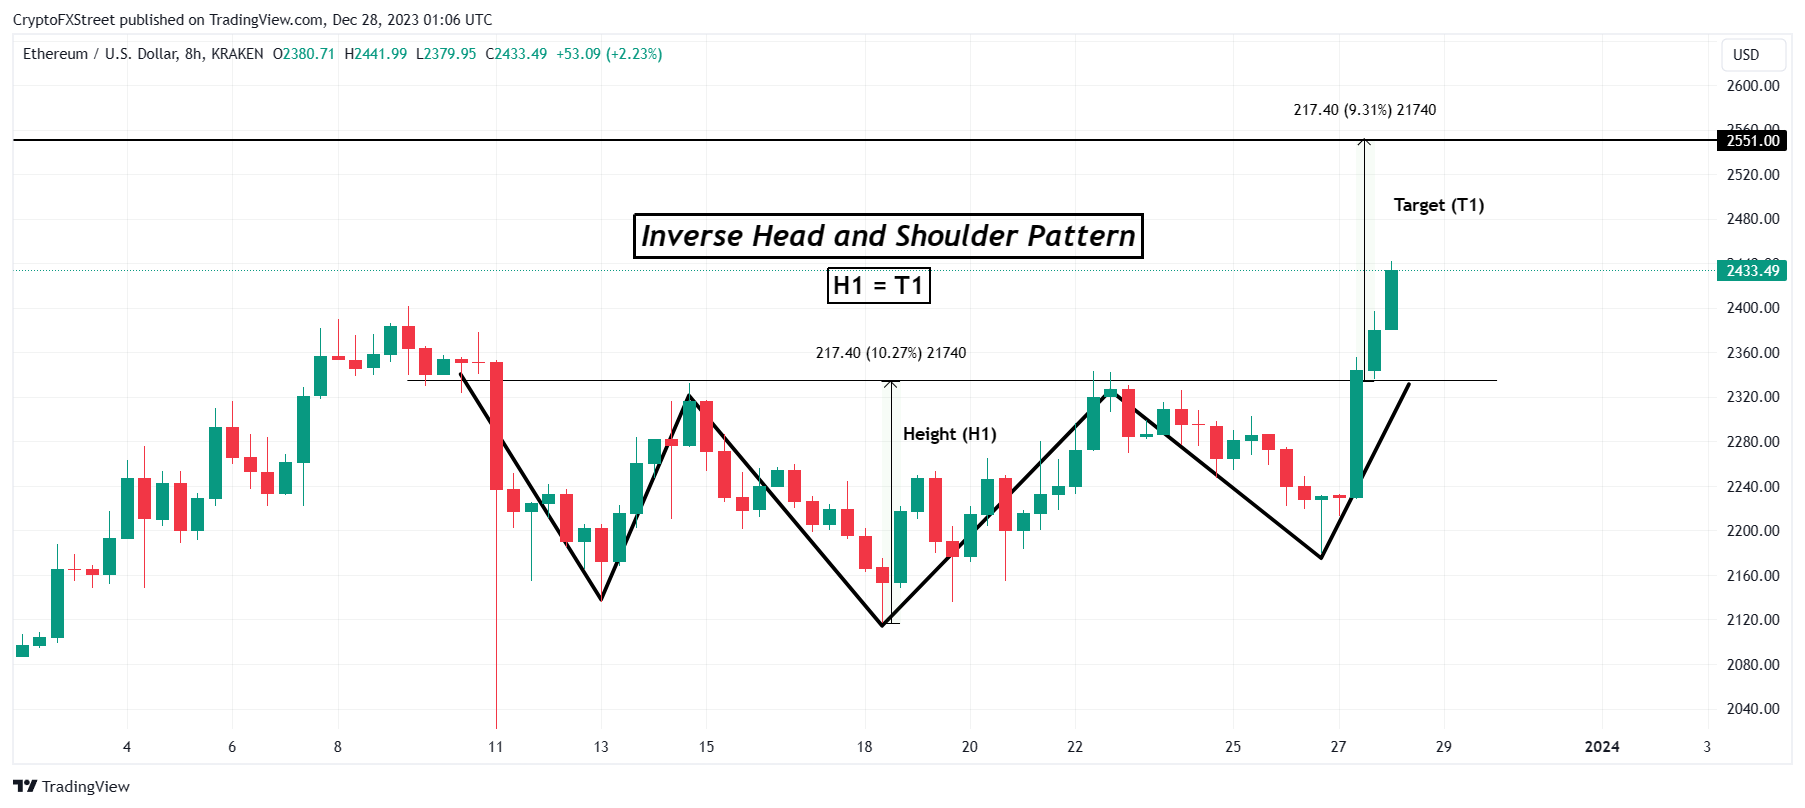
ETH/USD 8-hour chart
Trading at $2,433, ETH could still rise by another 5% before reaching the target price, breaching which would set the altcoin up for an increase to $3,000.
Price indicators, Relative Strength Index (RSI) and Moving Average Convergence Divergence (MACD), are both exhibiting room for bullishness.
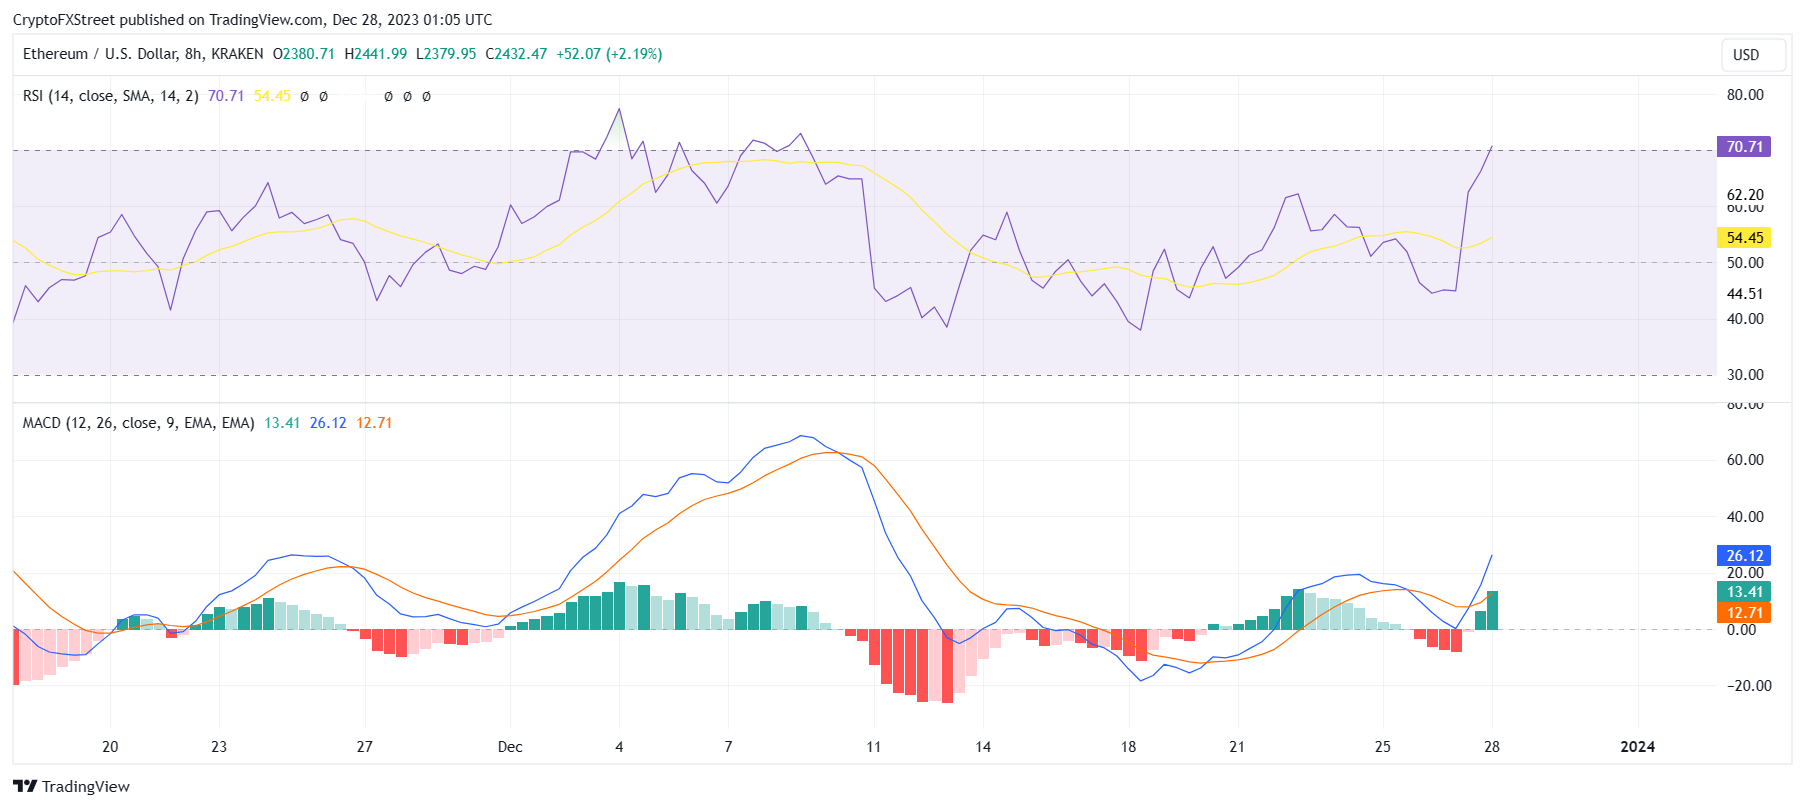
Ethereum RSI and MACD
However, a failed breach of the target price could bring ETH back down to $2,400, which could happen if short-term traders look for profit-taking as well, invalidating the bullish thesis.
Author

Aaryamann Shrivastava
FXStreet
Aaryamann Shrivastava is a Cryptocurrency journalist and market analyst with over 1,000 articles under his name. Graduated with an Honours in Journalism, he has been part of the crypto industry for more than a year now.


