Ethereum Price Prediction: ETH to test $1,700 after underwhelming CPI print
- Ethereum price recovered part of the 10% fall from the last week in the last 48 hours to trade at $1,582.
- Buyers are likely to take charge of the price momentum as indicators suggest a rise to $1,700.
- If the bullish momentum fails, a fall below $1,500 would invalidate the bullish thesis.

Ethereum price is pretty much following the king coin Bitcoin’s lead to chart a rise in the last two days. The sudden drop in price suggested a reversal in trend could be incoming, and it did, except not in favor of the bears.
Ethereum price aims for highs
Ethereum price registered a 4.5% increase in value over the previous 48 hours to recover part of the 9.8% loss noted in the last week. Trading at $1,582, ETH is rising back to retest the month-long resistance level at $1,675.
The sudden change in trend from bearish to bullish was unexpected as the Consumer Price Index (CPI) figures came in higher than forecasts. The year-on-year inflation rate came up to 6.4%, while the core CPI stood at 5.6%. But as Bitcoin rose to $22,600, Ethereum price followed suit and is nearing the $1,600 mark.
Going forward, price indicators are suggesting Ethereum price could note an uptick, with the Average Directional Index (ADX) slipping below the 25.0 threshold. The indicator is a measure of the strength of the active trend, which in the case of Ethereum, is a downtrend.
This is visible on the Parabolic Stop and Reverse (SAR) indicator, as the presence of black dots above the candlesticks highlights a downtrend. Thus the conclusion is that the downtrend is losing strengt. ETH price, meanwhile, is noting the start of an uptrend over the next few trading sessions.
The Relative Strength Index (RSI) suggests a similar bullish outlook as the indicator climbed back above the 50.0 mark. The presence of the RSI in the bullish neutral zone would likely support a bounce as the neutral line would act as support.
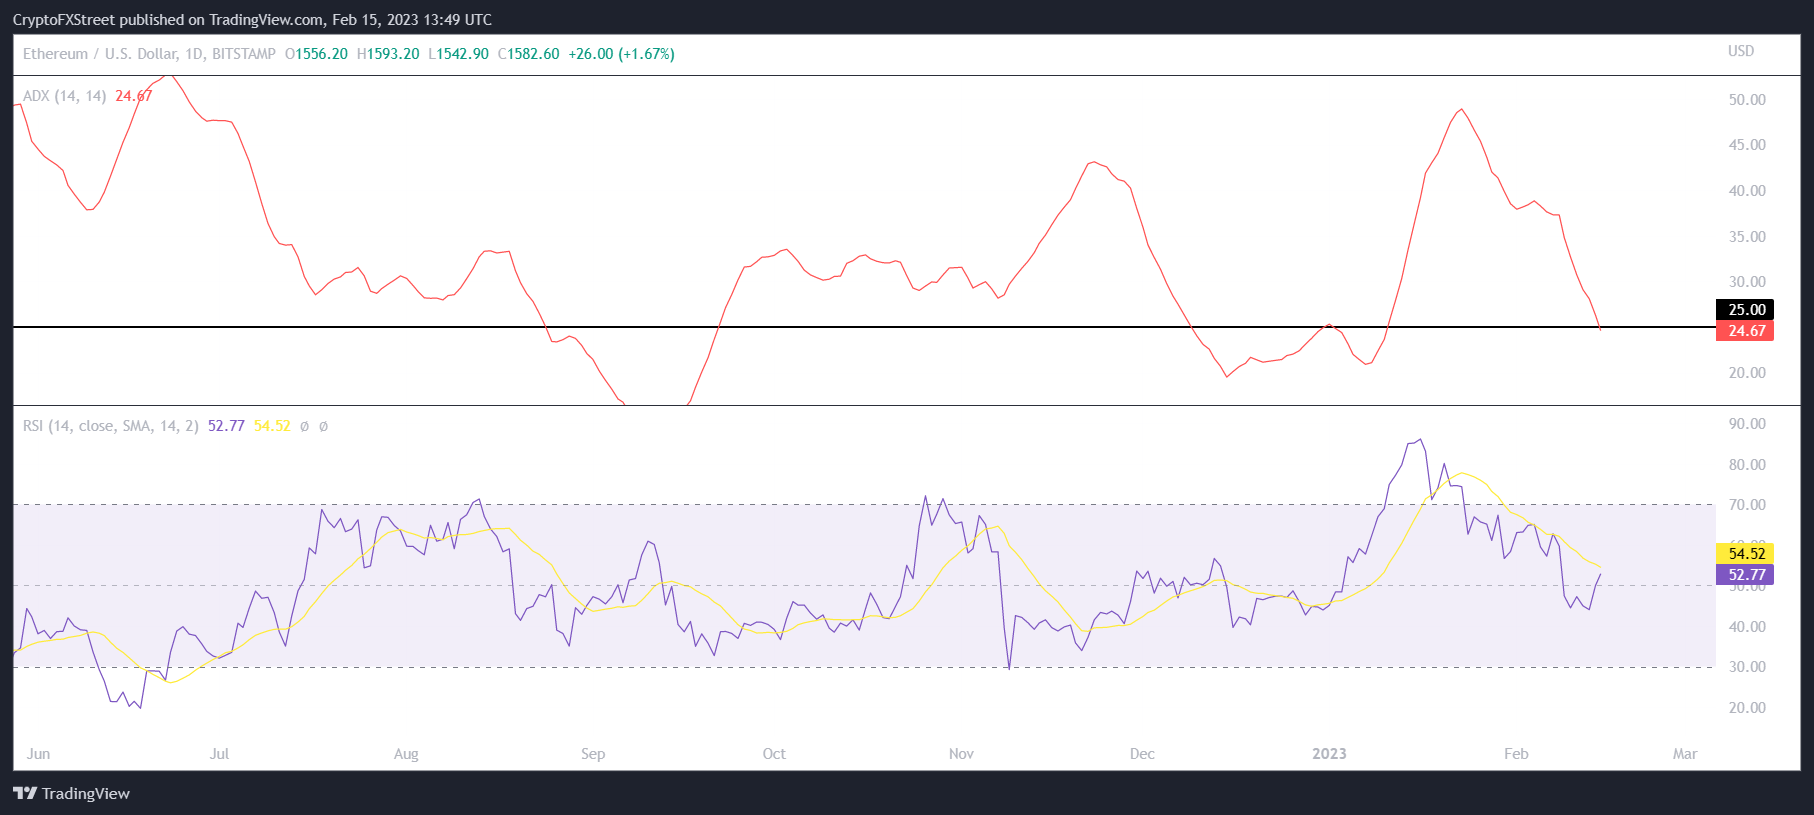
Ethereum RSI and ADX
Thus if Ethereum price follows this path, a breach of the resistance at $1,614 is certain. Flipping the same into support would push ETH to test the month-long critical resistance at $1,675. The altcoin closing above this level would enable a rise toward $1,700, marking a five-month high.
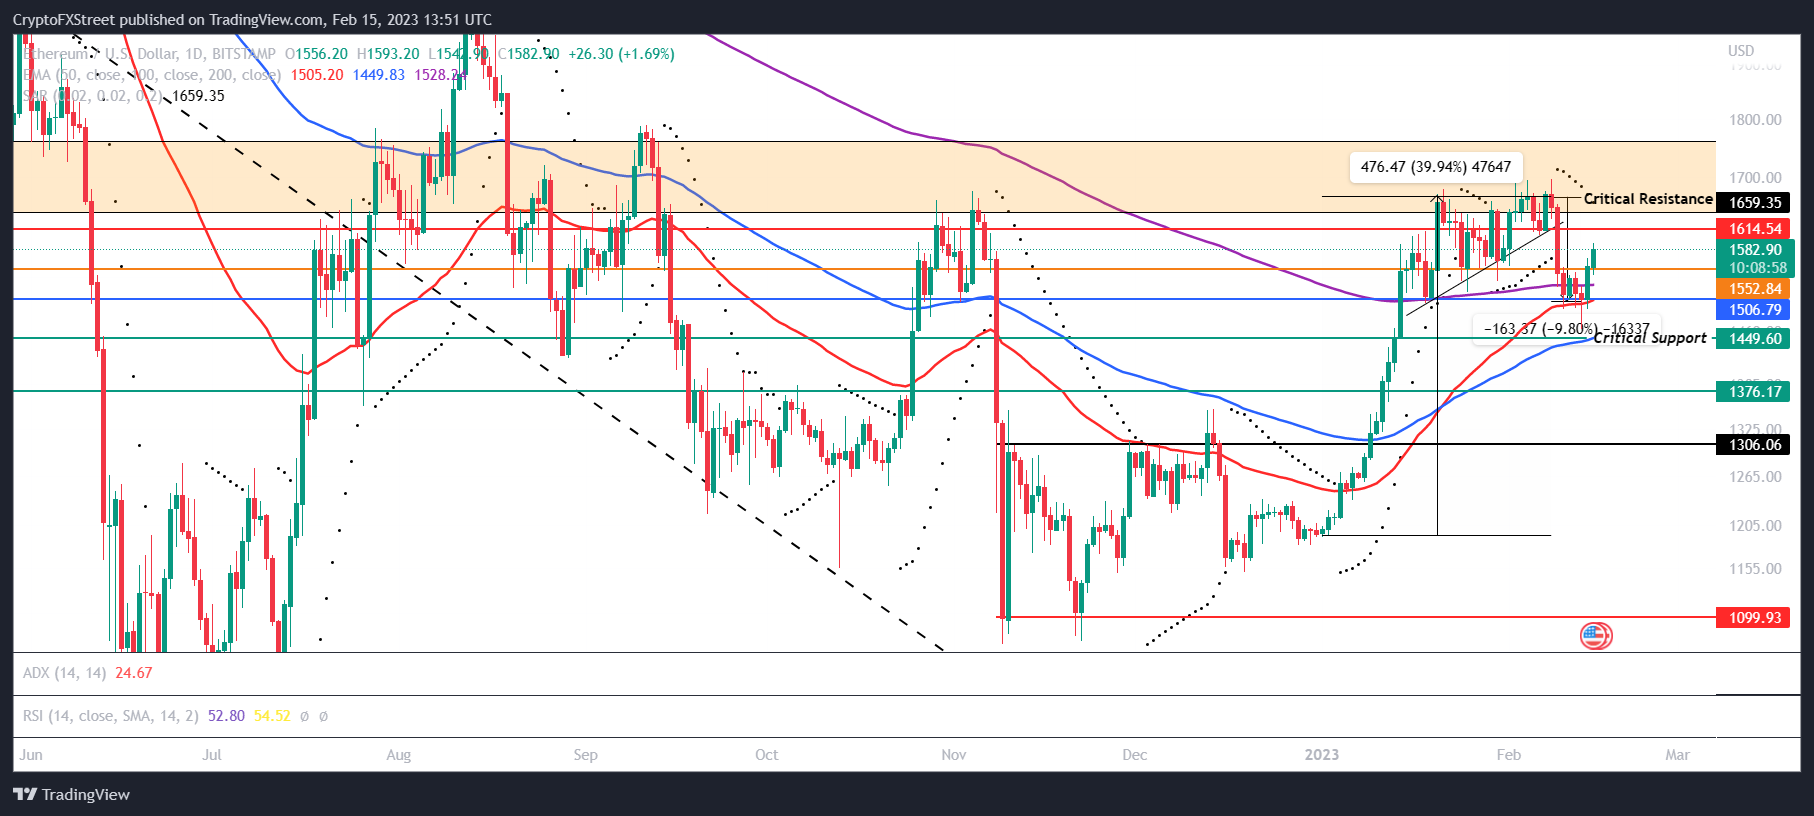
ETH/USD 1-day chart
But if the market reacts negatively and ETH loses its immediate support at $1,552, a drop to $1,506 is likely. Failure to bounce off of this support would push the price to test the critical support at $1,449, and a daily candlestick below this level would invalidate the bullish thesis, resulting in a dip to $1,306.
Author

Aaryamann Shrivastava
FXStreet
Aaryamann Shrivastava is a Cryptocurrency journalist and market analyst with over 1,000 articles under his name. Graduated with an Honours in Journalism, he has been part of the crypto industry for more than a year now.