Ethereum Price Prediction: ETH may correct 17% if crucial supply barrier is not breached
- Ethereum price is trading below the middle line of an ascending parallel channel.
- ETH could experience a 17% retracement to $1,735 if it gets rejected here.
- A new all-time high at $2,500 seems plausible if the breakout line at $2,350 is conquered.

The Ethereum price could retrace soon as multiple time frames hint at bulls’ exhaustion.
Ethereum price at inflection point
The Ethereum price set up multiple higher highs and higher lows since January 13. An ascending parallel channel forms when these swing points are connected using trend lines.
The latest swing low was created on March 25, which resulted in a 38% upswing just above $2,000. However, sellers have managed to push ETH below the parallel channel’s middle line to where it currently trades at $2,083.
The smart contracts platform token faces a crucial decision that could determine its trend for the foreseeable future.
If the buyers can manage to sustain above the Momentum Reversal Indicator’s (MRI) breakout line at $2,350, the Ethereum price could soon set up a new all-time high at $2,500.
However, a decisive close below $2,041 will see ETH drop 13% toward the 50-day Simple Moving Average (SMA). This level coincides with the 78.6% Fibonacci retracement level.
Supporting the bearish scenario is the weekly chart, which shows the Ethereum price forming higher highs while the Relative Strength Index (RSI) has created lower highs. Such a setup is known as a bearish divergence and forecasts a correction.
Additionally, the RSI is in the overbought zone, suggesting an overextended rally. The MRI complies with the RSI’s bearish outlook as it has spawned multiple A, B and C extensions, which indicate an incoming reversal.
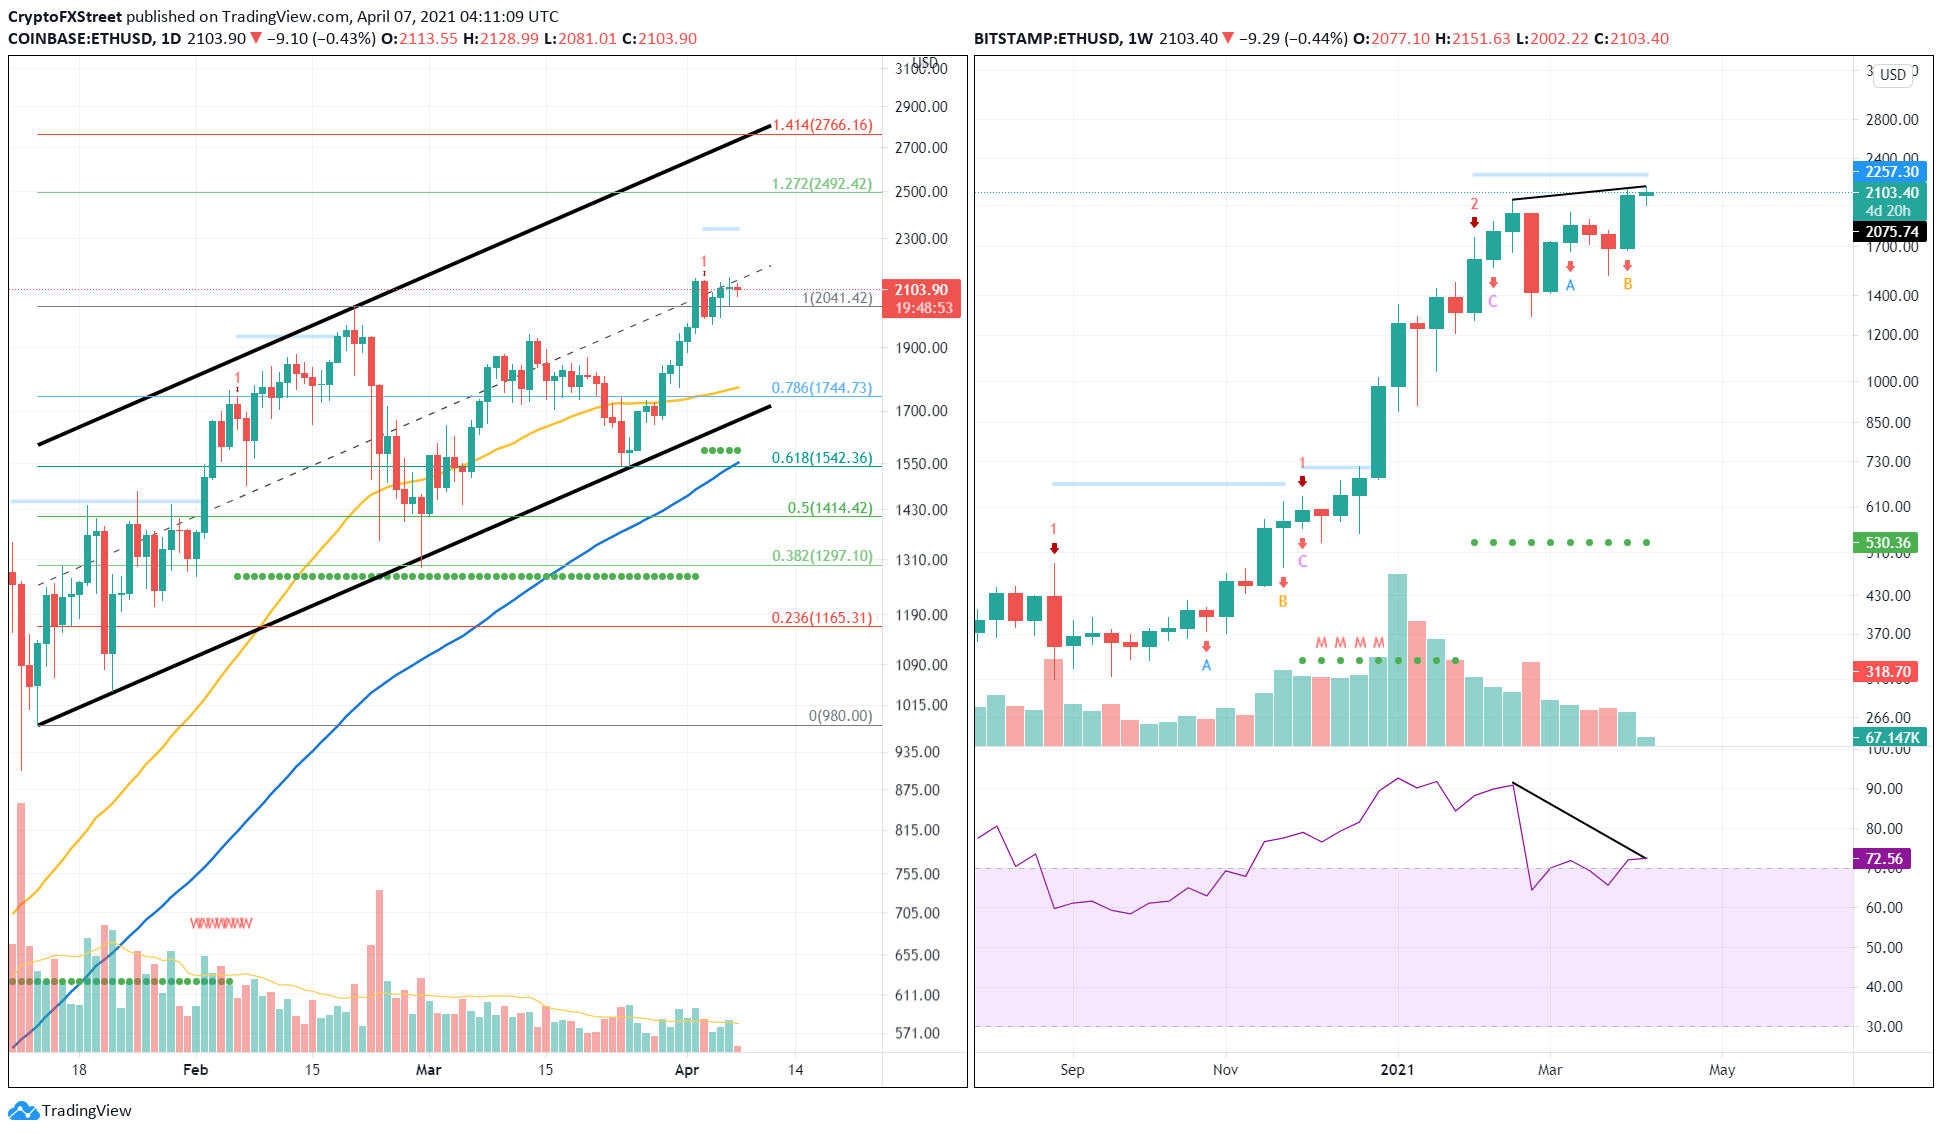
ETH/USD 1-day and 1-week chart
The number of whales holding 1,000,000 to 10,000,000 ETH tokens seems to significantly influence the Ethereum price, as seen in the chart below. A surge in these investors’ holdings saw the market value of ETH appreciate and vice versa.
Two of these market participants have left this category after the smart contracts platform created a new high at $2,144 on April 2. This 18% reduction in whales paints a bearish outlook for Ethereum.
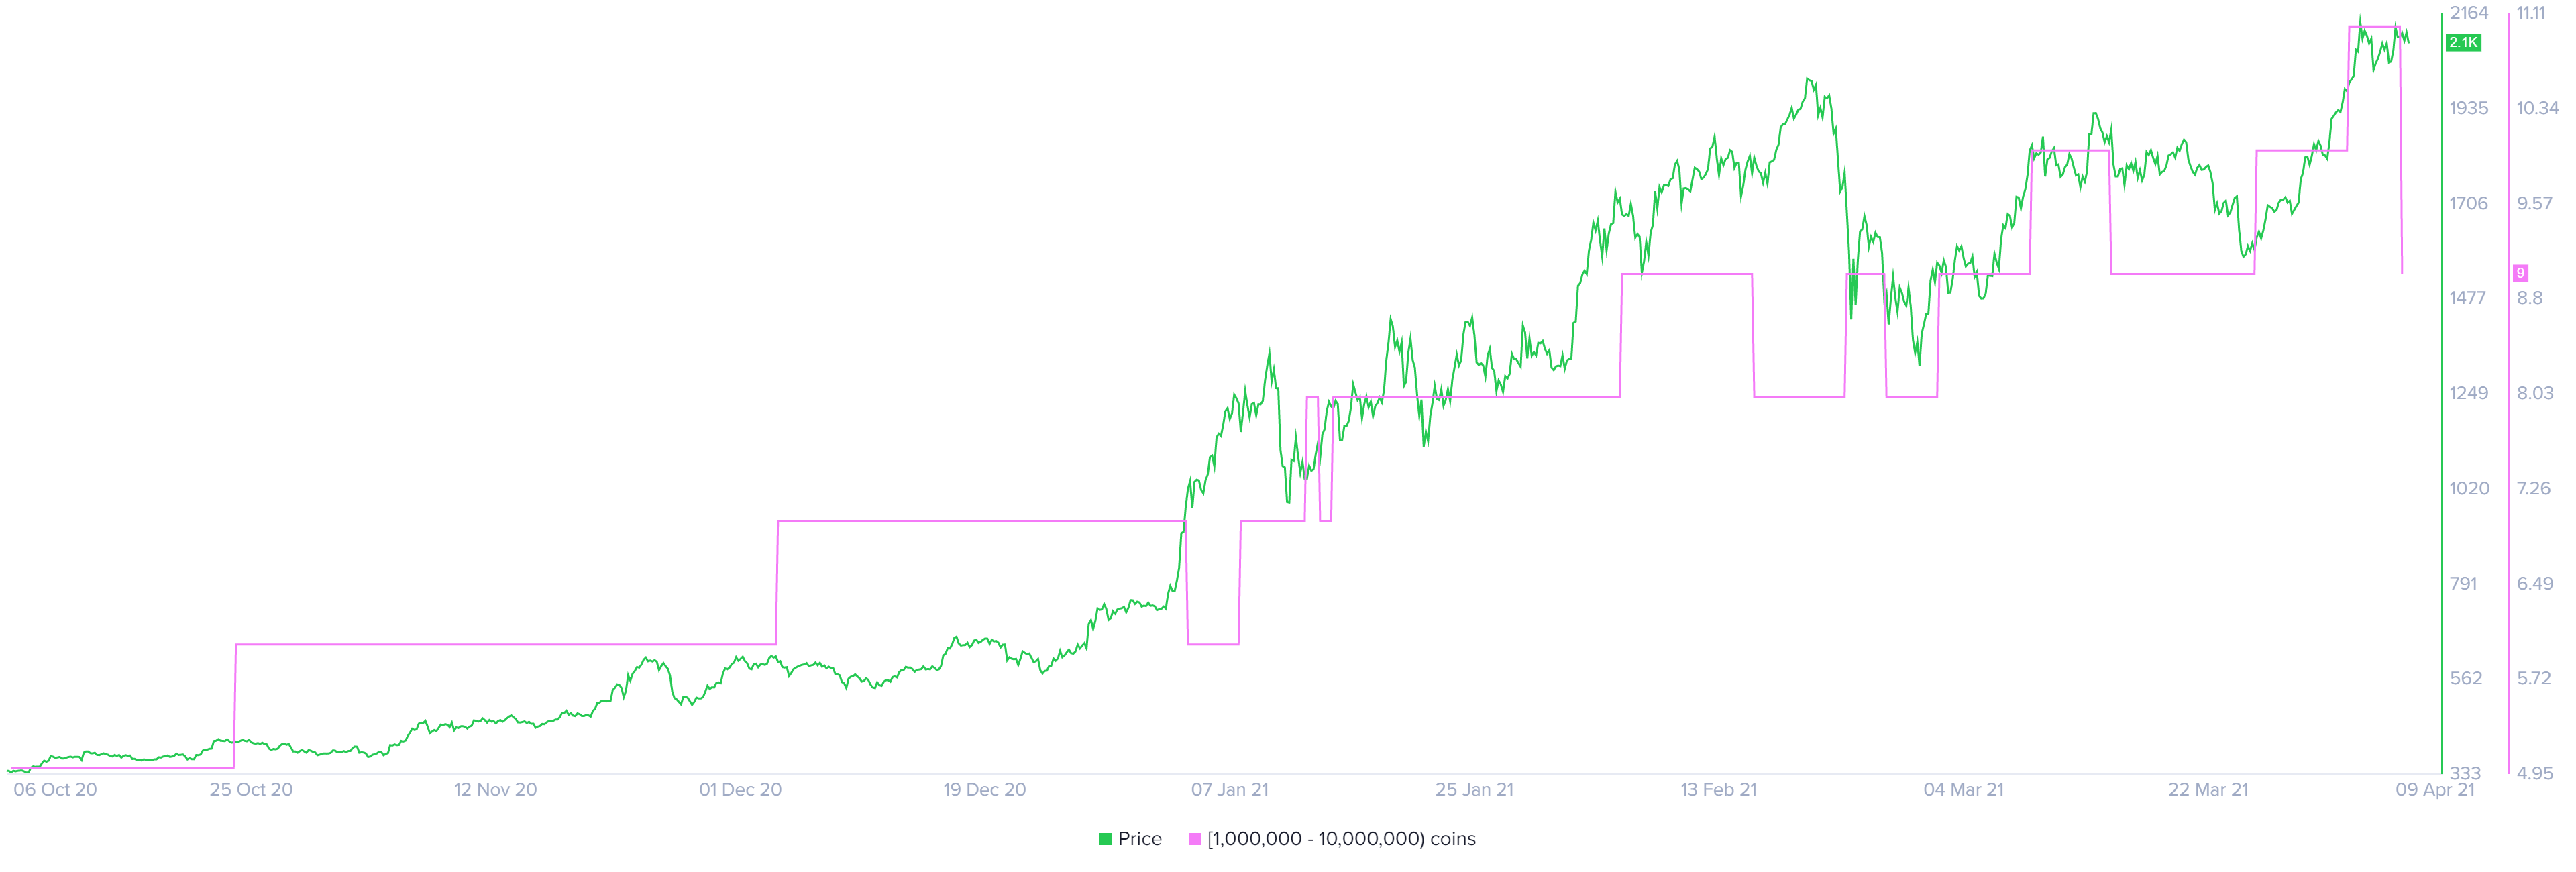
Ethereum supply distribution chart
Although ETH’s scenario looks grim, a bullish narrative is not unlikely, especially considering the declining ETH balance on exchanges.
Ether’s supply as a percent of total supply held by centralized entities has dropped 4% since hitting the record levels on April 2. This shrinkage effectively reduces the selling pressure and suggests that investors are confident in the bullish potential of ETH.
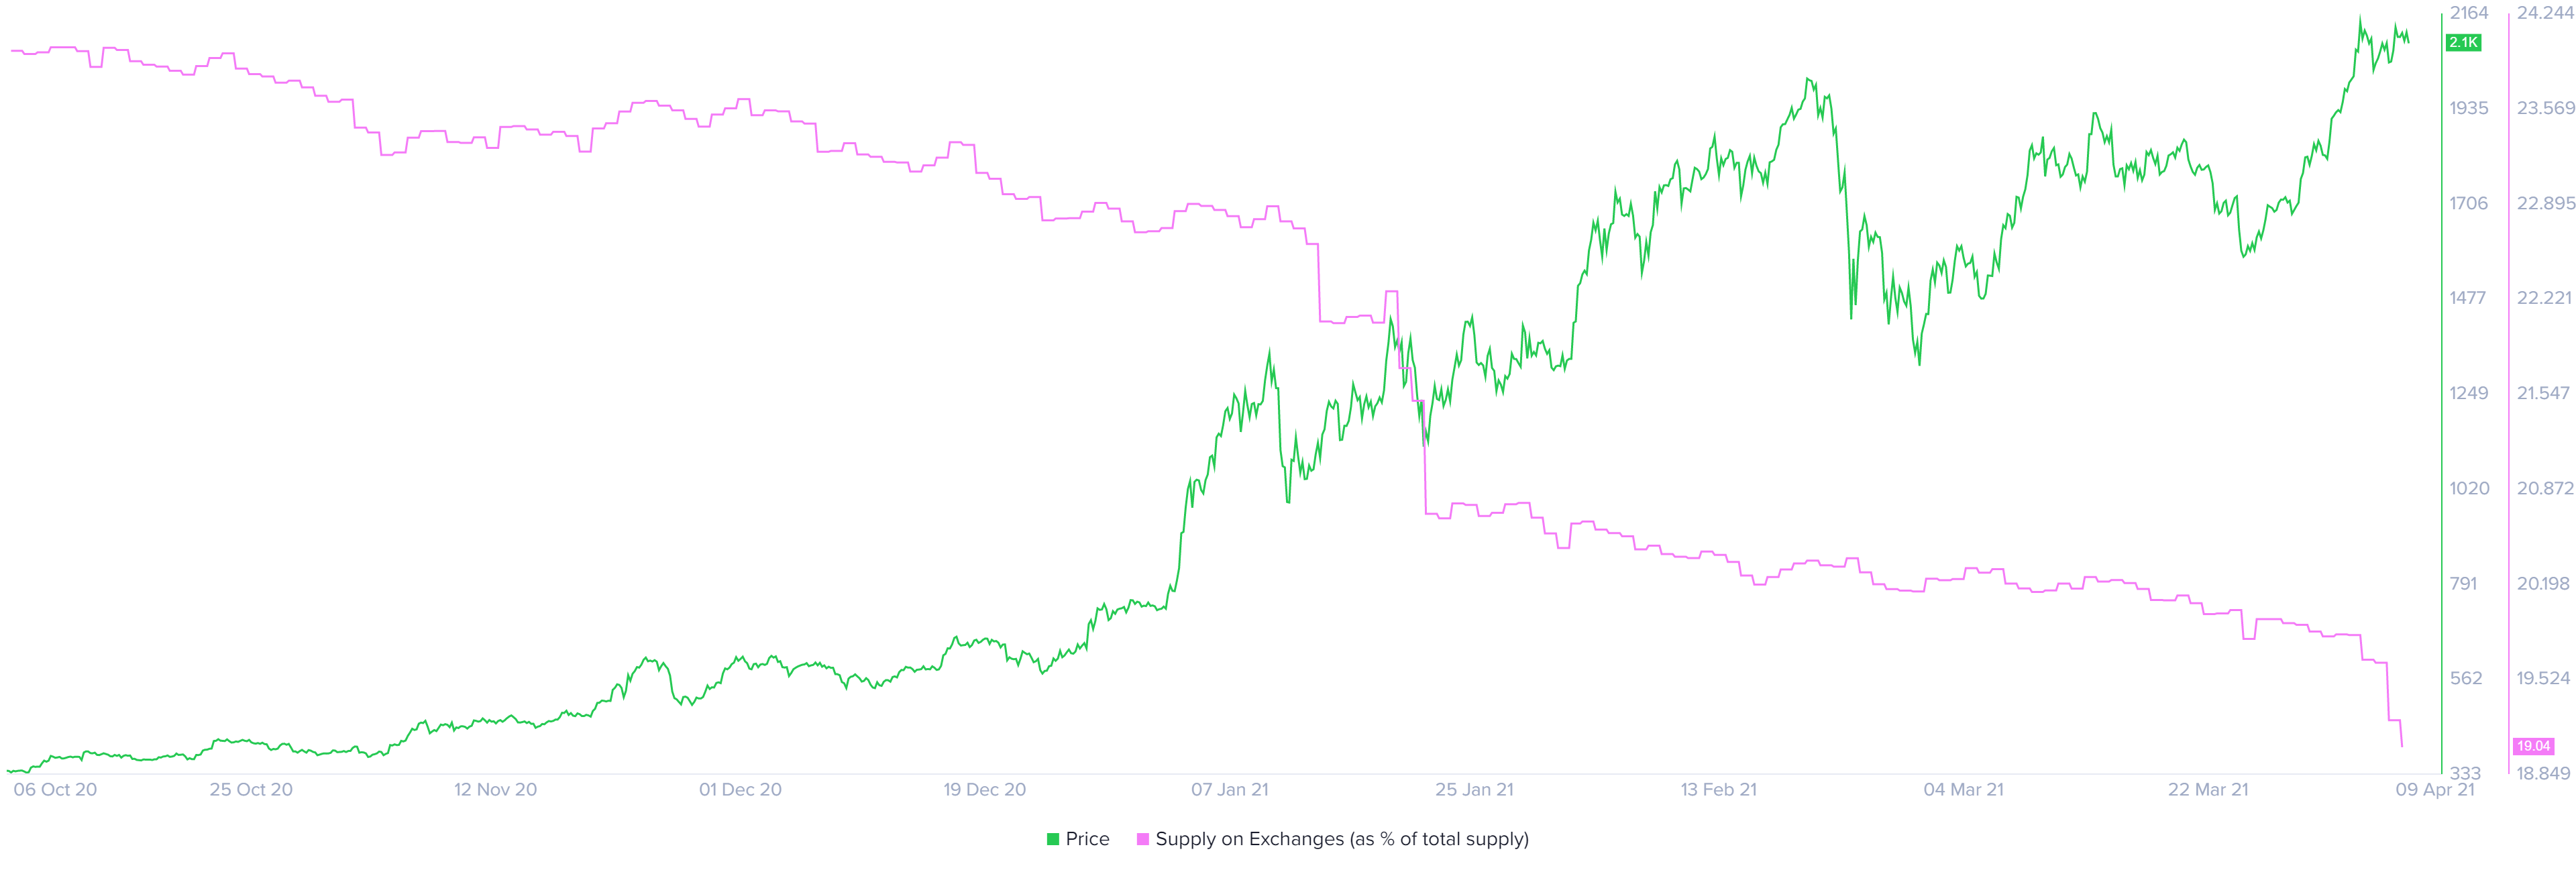
Ethereum supply on exchanges chart
A daily candlestick close above the MRI’s breakout line at $2,350 will trigger buyers to jump on the bandwagon. In such a case, the Ethereum price could surge 6% to the immediate supply barrier at $2,500.
Upon breaching this level, the altcoin giant could increase 10% to hit the 141.4% Fibonacci extension level at $2,765.
Author

Akash Girimath
FXStreet
Akash Girimath is a Mechanical Engineer interested in the chaos of the financial markets. Trying to make sense of this convoluted yet fascinating space, he switched his engineering job to become a crypto reporter and analyst.


