• ETH buyers contemplating the next move higher.
  • $1400 remains in sight so long as 21-SMA on 4H chart holds.
  • Overbought conditions on 1D chart point to a brief bullish consolidation

ETH/USD seemingly lacks a clear directional bias while trading around $1200 so far this Saturday, having staged a strong bounce from Friday’s deep correction to sub-$1100 levels.

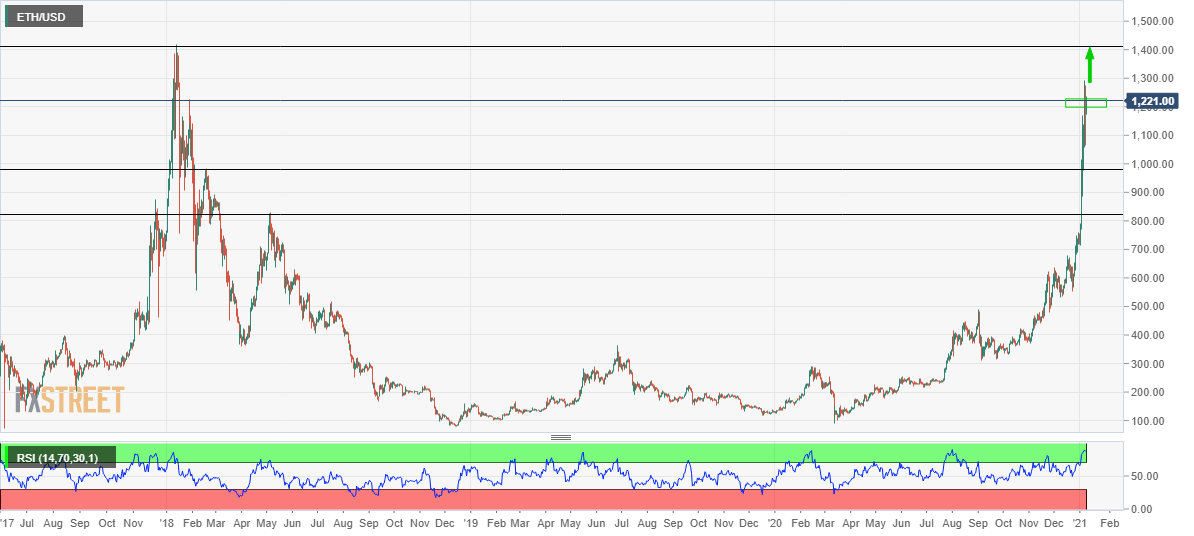
ETH/USD: Daily chart

As observed in the daily chart, Ethereum has additional room to the upside, with eyes set on the January 14 2018 high at $1419.

However, doji candlesticks formed for the third day in a row have left the buyers unnerved. Further, the 14-day Relative Strength Index (RSI) holds in the overbought region, around 88.0, flashing caution for the bulls.  

Therefore, the price could enter a period of consolidation around the current levels before the buyers gear up for re-entry. At the moment, there seems to be strong demand around the $12K mark.

Friday’s low of $1063 could be put to test if the corrective pressure mounts.

ETH/USD: Four-hour chart

Narrowing down to the four-hour chart structure, the further upside appears more compelling, as the no. 2 coin has once again managed to defend the critical 21-simple moving average (SMA), which is currently placed at $1194.

It’s worth noting that the price has not closed the candle below the 21-SMA since January 2 2021.

ETH/USD wavers within a potential rising wedge pattern. A breach of the abovementioned crucial support could expose the rising trendline support at $1139, below which Friday’s low remains in sight.

However, a run up towards the rising trendline resistance at $1348 and beyond looks likely, as the RSI points north above the midline, now standing firmer at 59.80.

ETH/USD: Additional levels to watch

ETH/USD

Overview
Today last price 1223.94
Today Daily Change 11.49
Today Daily Change % 0.94
Today daily open 1217.35
 
Trends
Daily SMA20 813.48
Daily SMA50 675.41
Daily SMA100 538.71
Daily SMA200 436.32
 
Levels
Previous Daily High 1275
Previous Daily Low 1063.18
Previous Weekly High 1291.94
Previous Weekly Low 770
Previous Monthly High 759
Previous Monthly Low 530.32
Daily Fibonacci 38.2% 1144.1
Daily Fibonacci 61.8% 1194.08
Daily Pivot Point S1 1095.35
Daily Pivot Point S2 973.36
Daily Pivot Point S3 883.53
Daily Pivot Point R1 1307.17
Daily Pivot Point R2 1397
Daily Pivot Point R3 1518.99


Information on these pages contains forward-looking statements that involve risks and uncertainties. Markets and instruments profiled on this page are for informational purposes only and should not in any way come across as a recommendation to buy or sell in these assets. You should do your own thorough research before making any investment decisions. FXStreet does not in any way guarantee that this information is free from mistakes, errors, or material misstatements. It also does not guarantee that this information is of a timely nature. Investing in Open Markets involves a great deal of risk, including the loss of all or a portion of your investment, as well as emotional distress. All risks, losses and costs associated with investing, including total loss of principal, are your responsibility. The views and opinions expressed in this article are those of the authors and do not necessarily reflect the official policy or position of FXStreet nor its advertisers. The author will not be held responsible for information that is found at the end of links posted on this page.

If not otherwise explicitly mentioned in the body of the article, at the time of writing, the author has no position in any stock mentioned in this article and no business relationship with any company mentioned. The author has not received compensation for writing this article, other than from FXStreet.

FXStreet and the author do not provide personalized recommendations. The author makes no representations as to the accuracy, completeness, or suitability of this information. FXStreet and the author will not be liable for any errors, omissions or any losses, injuries or damages arising from this information and its display or use. Errors and omissions excepted.

The author and FXStreet are not registered investment advisors and nothing in this article is intended to be investment advice.

Recommended content


Recommended Content

Editors’ Picks

Bitcoin is showing rising correlation with the S&P 500

Bitcoin is showing rising correlation with the S&P 500

Bitcoin and the crypto market have been in an uptrend since Wednesday following the Federal Reserve's decision to cut interest rates by 50 basis points. Bitcoin is up nearly 3% in the past 24 hours, rising briefly above the $63,000 level for the first time in three weeks.

More Bitcoin News
Ethereum rallies over 6% following decision to split Pectra upgrade into two phases

Ethereum rallies over 6% following decision to split Pectra upgrade into two phases

In its Consensus Layer Call on Thursday, Ethereum developers decided to split the upcoming Pectra upgrade into two batches. The decision follows concerns about potential risks in shipping the previously approved series of Ethereum improvement proposals.

More Ethereum News
Consensys case against SEC over Ethereum dismissed by Texas court

Consensys case against SEC over Ethereum dismissed by Texas court

Consensys announced dismissal of a case it filed against the SEC in April about the agency's alleged actions against Ethereum. Judge Reed O'Connor of the Northern District of Texas dismissed the case on Thursday. Consensys claims that the court failed to examine the "merits" of its claim against the SEC.

More Cryptocurrencies News
XRP eyes gains as Ripple gears up for stablecoin launch, Grayscale XRP Trust notes rising NAV

XRP eyes gains as Ripple gears up for stablecoin launch, Grayscale XRP Trust notes rising NAV

Ripple (XRP) gained 2.3% since the start of the week. The altcoin’s gains are likely powered by key market movers that include Ripple USD stablecoin, Grayscale XRP Trust performance and the demand for the altcoin among institutional investors. 

More Ripple News
Bitcoin: On the road to $60,000

Bitcoin: On the road to $60,000

Bitcoin price retested and bounced off from the daily support level of $56,000 this week. US spot Bitcoin ETFs posted $140.7 million in inflows until Thursday and on-chain data supports a bullish outlook.

Read full analysis
Moneta Markets review 2024: All you need to know

Moneta Markets review 2024: All you need to know

VERIFIED In this review, the FXStreet team provides an independent and thorough analysis based on direct testing and real experiences with Moneta Markets – an excellent broker for novice to intermediate forex traders who want to broaden their knowledge base.

Read More

BTC

ETH

XRP