Ethereum price on cusp of massive breakout if key level holds
- Ethereum price is still contained inside an ascending broadening wedge pattern on the 12-hour chart.
- Most on-chain metrics are still in favor of ETH bulls despite the recent correction.
- The available supply of Ethereum continues to decrease significantly.

Ethereum price had a significant 23% correction in the past week but holds above a key support level on the 12-hour chart. The digital asset still has robust on-chain metrics supporting it and aims for a rebound.
Ethereum price could be on the verge of a new uptrend
On the 12-hour chart, Ethereum price continues trading inside an ascending broadening wedge pattern formed in January 2021. In the past 48 hours, ETH held above the 50 SMA support level and aims for a rebound toward the upper trend line of the pattern all the way up at $3,000.
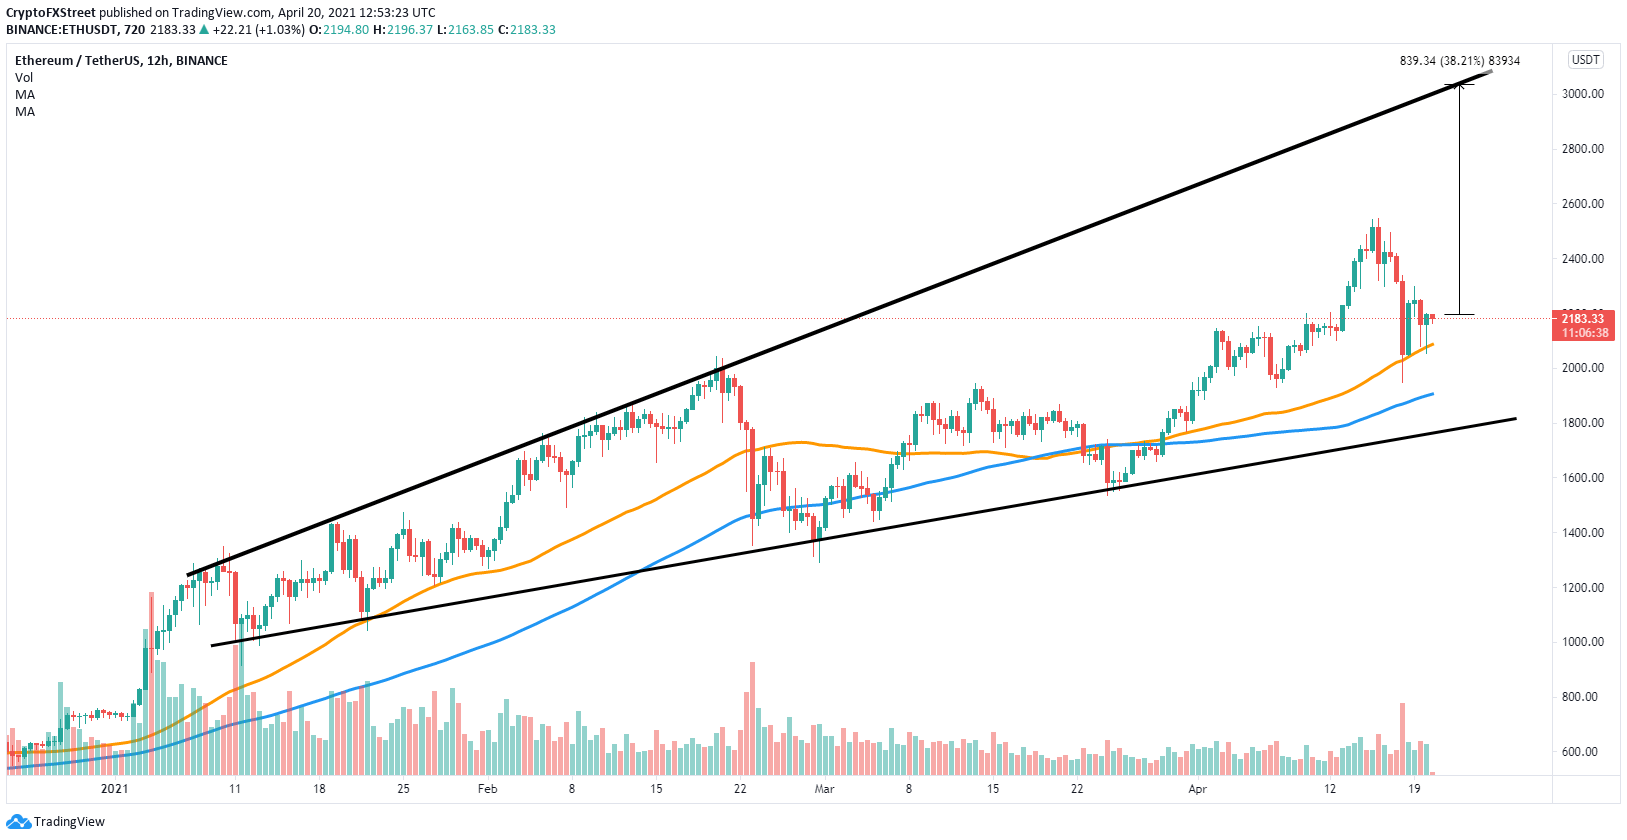
ETH/USD 12-hour chart
Despite price volatility, the percentage of Ethereum coins inside exchanges has continued to decrease from 19% on April 15 to 18.4%. This indicates that investors are not eager to take profits and remain confident in the project for the long term.
%20[14.52.21,%2020%20Apr,%202021]-637545216504147584.png)
ETH Supply on Exchanges
The In/Out of the Money Around Price (IOMAP) chart shows only one crucial resistance area between $2,184 and $2,241 where 157,000 addresses purchased 10 million ETH. A breakout above this point should quickly drive Ethereum to its previous all-time high of $2,548 and up to $3,000 in the long term.
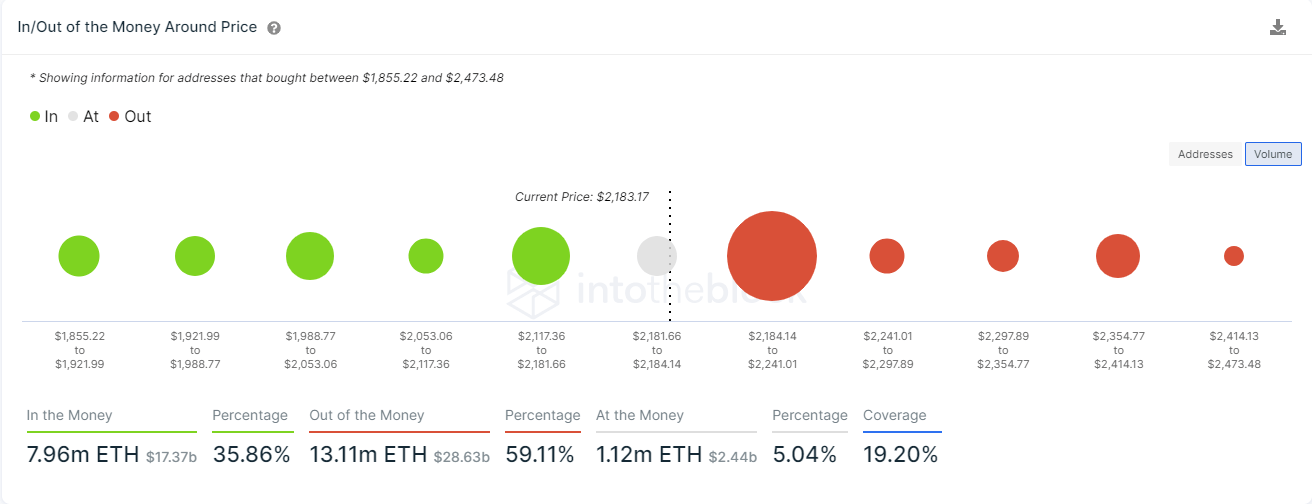
ETH IOMAP chart
However, the 50 SMA support level on the 12-hour chart must hold at all costs. Otherwise, Ethereum would enter a significant correction period and could easily fall toward the 100 SMA at $1,900 and as low as $1,780 at the lower trend line support.
Author

Lorenzo Stroe
Independent Analyst
Lorenzo is an experienced Technical Analyst and Content Writer who has been working in the cryptocurrency industry since 2012. He also has a passion for trading.