Ethereum price stabilizes at critical support as bullish thesis remains unchanged
- Ethereum price rebounds to close Sunday in the top 25% of the daily range.
- ETH currently set to close with an inside day, suggesting selling exhausted.
- Be alert for a double bottom pattern on the intra-day charts.

Ethereum price has stabilized at the February 20 high at $2,041, keeping the longer-term bullish thesis intact. A daily close below the support would downgrade the working thesis and raise the odds of a deeper correction or a complete reset.
Ethereum price will return to the persuasive fundamental story of the blockchain
Ethereum Intheblock In/Out of the Money Around Price (IOMAP) data shows heavy resistance between $2,198 to $2,263, where 158.1k addresses bought 8.71 million ETH. The price range envelops the 161.8% Fibonacci extension of the 2018 bear market at $2,247.68.
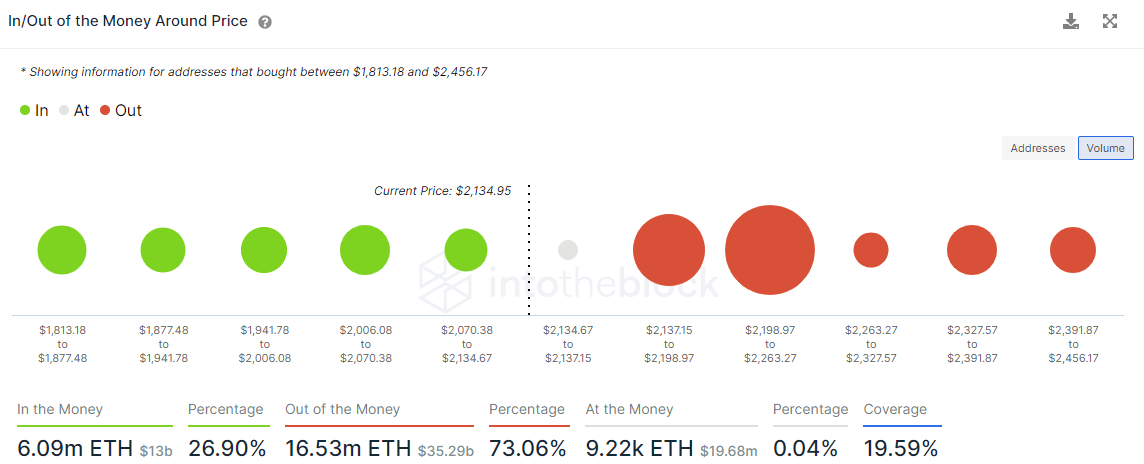
ETH IOMAP data
Based on just a technical perspective, it is no surprise that yesterday’s close was $2,241, basically on the 161.8% extension of the 2018 bear market at $2,247.68. When you add the IOMAP data shown above, it becomes clear that a return of a more positive outlook starts with a daily close above $2,263.27.
The second level of resistance returns to the 161.8% extension of the February correction at $2,504, followed by the symmetrical triangle measured move target of $2,507. A daily close above the April 16 high of $2,548 would further support the rally in 2021.
The continuation of the rally will find resistance at the topside trend line currently at $2,605, the 138.2 extension of this correction at $2,795, and lastly, at the 161.8% of this correction at $2,959.
Traders with bigger aspirations should turn to the 261.8% extension of the February correction at $3,253.
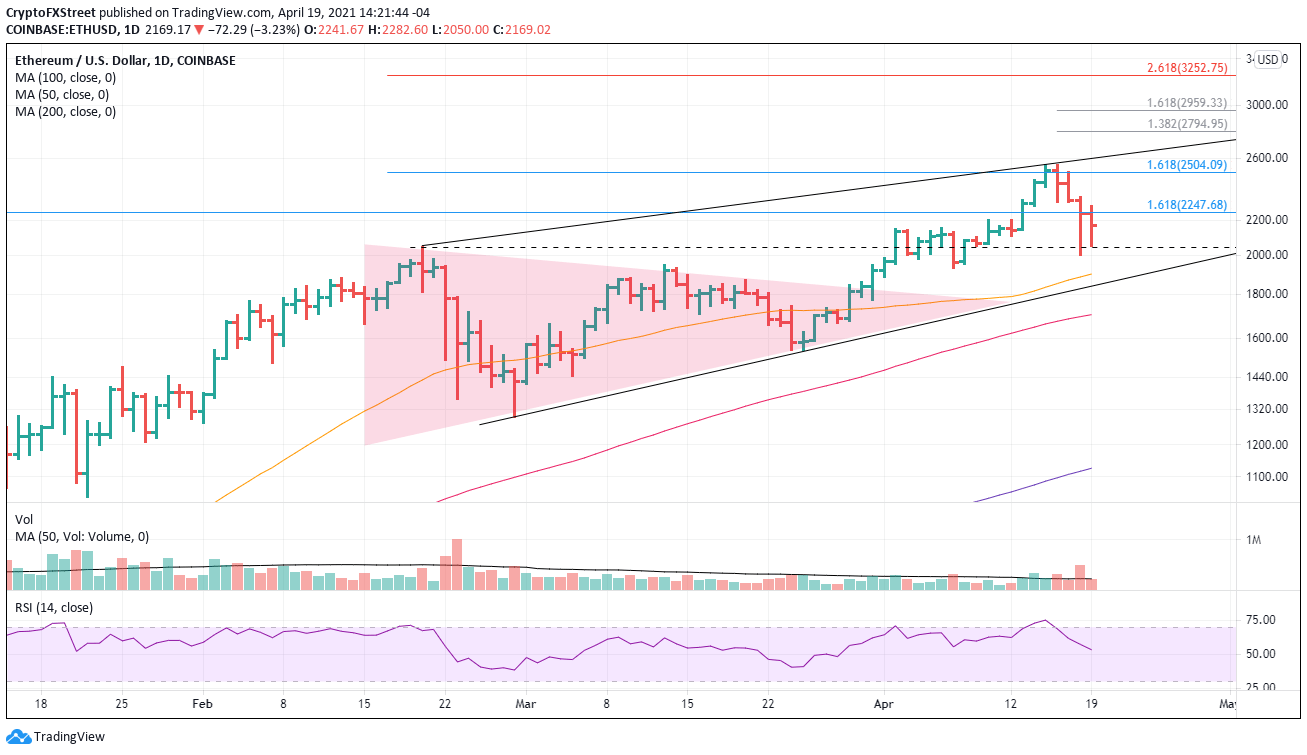
ETH/USD daily chart
On the downside, there is a slow, incremental structure of support beginning with the 50-day simple moving average (SMA) at $1,901 and then the rising trendline from the February low at $1,833 followed by the 100-day SMA at $1,704.
Author

Sheldon McIntyre, CMT
Independent Analyst
Sheldon has 24 years of investment experience holding various positions in companies based in the United States and Chile. His core competencies include BRIC and G-10 equity markets, swing and position trading and technical analysis.


