Ethereum price moves toward $3K, but pro traders choose not to add leverage

ETH price is storming toward a key resistance level, but pro traders are reluctant to add leverage for three important reasons.
Even though Ether (ETH) price bounced over 20% from the $2,300 low on Feb. 22, derivatives data shows that investors are still cautious. To date, Ether's price is down 24% for the year, and key overhead resistances lay ahead.
Ethereum's most pressing issue has been high network transaction fees and investors are increasingly worried that this will remain an issue even after the network integrates its long-awaited upgrades.
For example, the 7-day network average transaction fee is still above $18, while the network value locked in smart contracts (TVL) decreased 25% to $111 billion between Jan. 1 and Feb. 27. This negative indicator could partially explain why Ether has been down-trending since early February.
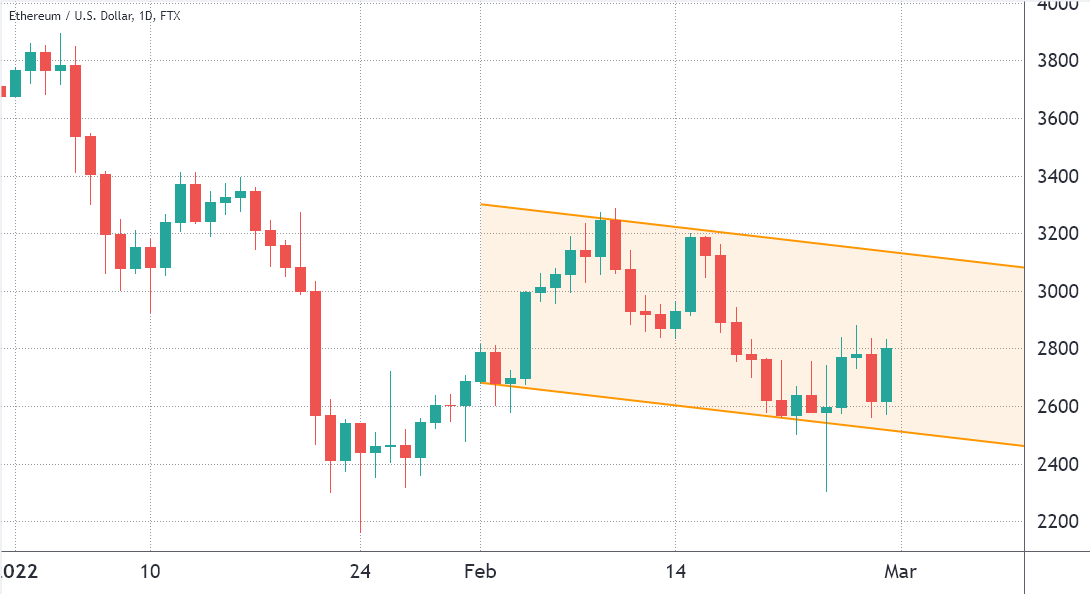
Ether/USD price at FTX. Source: TradingView
The above channel currently shows resistance at $3,100, while the daily closing price support stands at $2,500. Therefore, a 14% rally from the current $2,750 level needs to happen for the prevailing downward trend to be canceled.
Derivatives markets show fear as the prevailing sentiment
The 25% delta skew compares equivalent call (buy) and put (sell) options. The indicator will turn positive when "fear" is prevalent because the protective put options premium is higher than the call options.
The opposite holds when market makers are bullish, causing the 25% delta skew to shift to the negative area. Readings between negative 8% and positive 8% are usually deemed neutral.
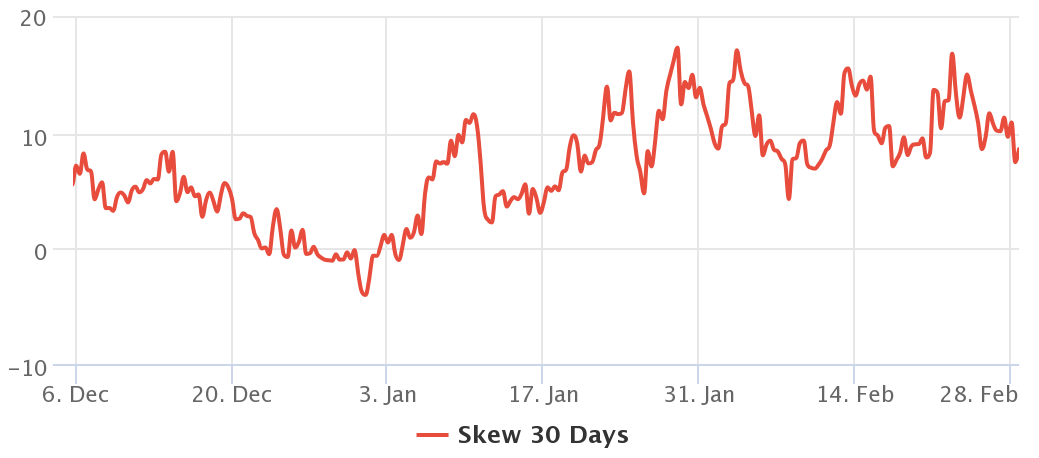
Deribit Ether 30-day options 25% delta skew. Source: laevitas.ch
The above chart shows that Ether option traders have been signaling bearishness since Feb. 11, just as Ether failed to break the $3,200 resistance. Furthermore, the current 8.5% reading shows no confidence from market markers and whales despite the 7.5% price increase on Feb. 28.
Exchange-provided data highlights traders' long-to-short net positioning. By analyzing every client's position on the spot, perpetual and futures contracts, one can better understand whether professional traders are leaning bullish or bearish.
There are occasional methodological discrepancies between different exchanges, so viewers should monitor changes instead of absolute figures.
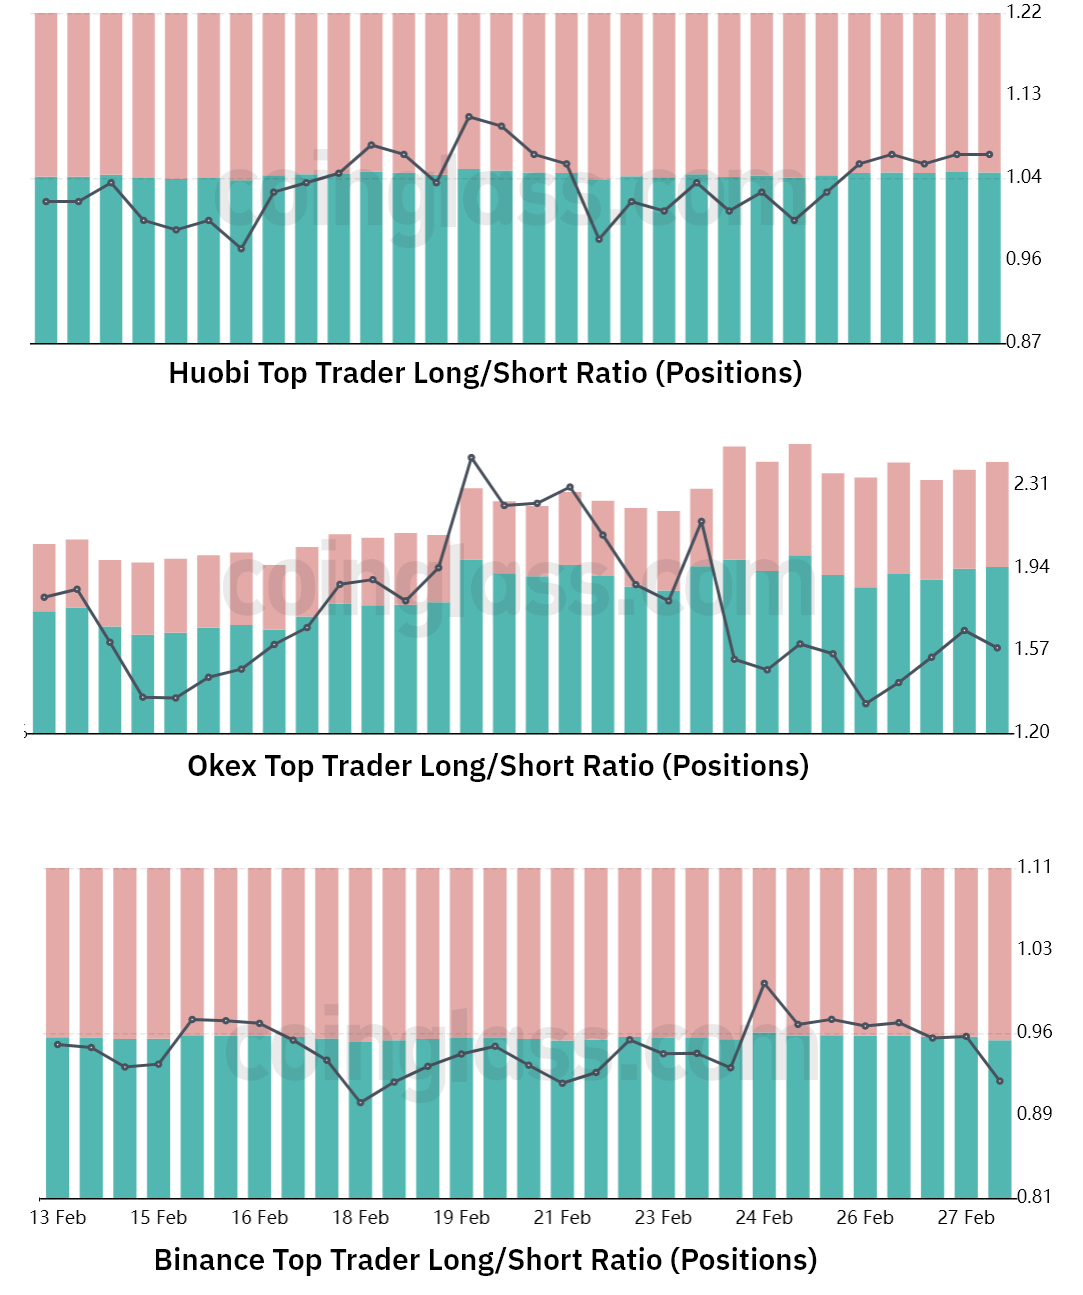
Exchanges' top traders Ether long-to-short ratio. Source: Coinglass
Even with Ether's 21.5% rally since Feb. 24, top traders on Binance, Huobi and OKX have decreased their leverage longs. More precisely, Huobi was the only exchange facing a modest reduction in the top traders' long-to-short ratio as the indicator moved from 1.04 to 1.07.
However, this impact was more than compensated by OKX traders increasing their bullish bets from 2.15 to 1.58 from Feb. 24 to Feb. 28. On average, top traders decreased their longs by 8% over the past four days.
Top traders could be caught by surprise
From the perspective of the metrics discussed above, there is hardly a sense of bullishness present in the Ether market. Moreover, data suggests that pro traders are unwilling to add long positions as expressed by both futures and options markets.
Of course, even professional traders get it wrong, and a short cover should happen if Ether breaks the current downtrend channel $3,100 resistance. Still, it's also important to at least recognize that there's little interest in buying using derivatives at the current level.
Author

Cointelegraph Team
Cointelegraph
We are privileged enough to work with the best and brightest in Bitcoin.