Ethereum price bullish reversal sets ETH on a return to $3,820
- Ethereum price is forming a bullish chart pattern that projects a 12% bounce toward $3,820.
- Only a slice above $3,398 would validate the optimistic forecast.
- A stiff hurdle may emerge at the 78.6% Fibonacci retracement level at $3,709.

Ethereum price could be preparing for a reversal as a bullish chart pattern is forming. ETH bulls are eyeing a 12% ascent toward $3,820 if the token slices above $3,398, validating the optimistic thesis.
Ethereum bulls eye 12% climb
Ethereum price is currently forming a cup-and-handle pattern on the 4-hour chart, suggesting a bullish reversal could be in the offing. In order for the bullish target given by the governing technical pattern to be on the radar, ETH must slice above the neckline at $3,398.
The first line of resistance for Ethereum price is at the 38.2% Fibonacci retracement level at $3,347. If the bulls manage to overcome this obstacle, ETH may aim to tag the neckline of the prevailing chart pattern at $3,398.
A slice above the neckline may put a 12% climb toward $3,820 on the radar, validating the bullish chart pattern.
Ethereum price will continue to face challenges ahead before the optimistic target could be reached. The following hurdle for ETH is at the 50% retracement level at $3,453, then at the 100 four-hour Simple Moving Average (SMA) at $3,488.
Additional headwinds may emerge at the 61.8% Fibonacci retracement level at $3,558, then at the declining resistance line at $3,709, coinciding with the 200 four-hour SMA and the 78.6% Fibonacci retracement level.
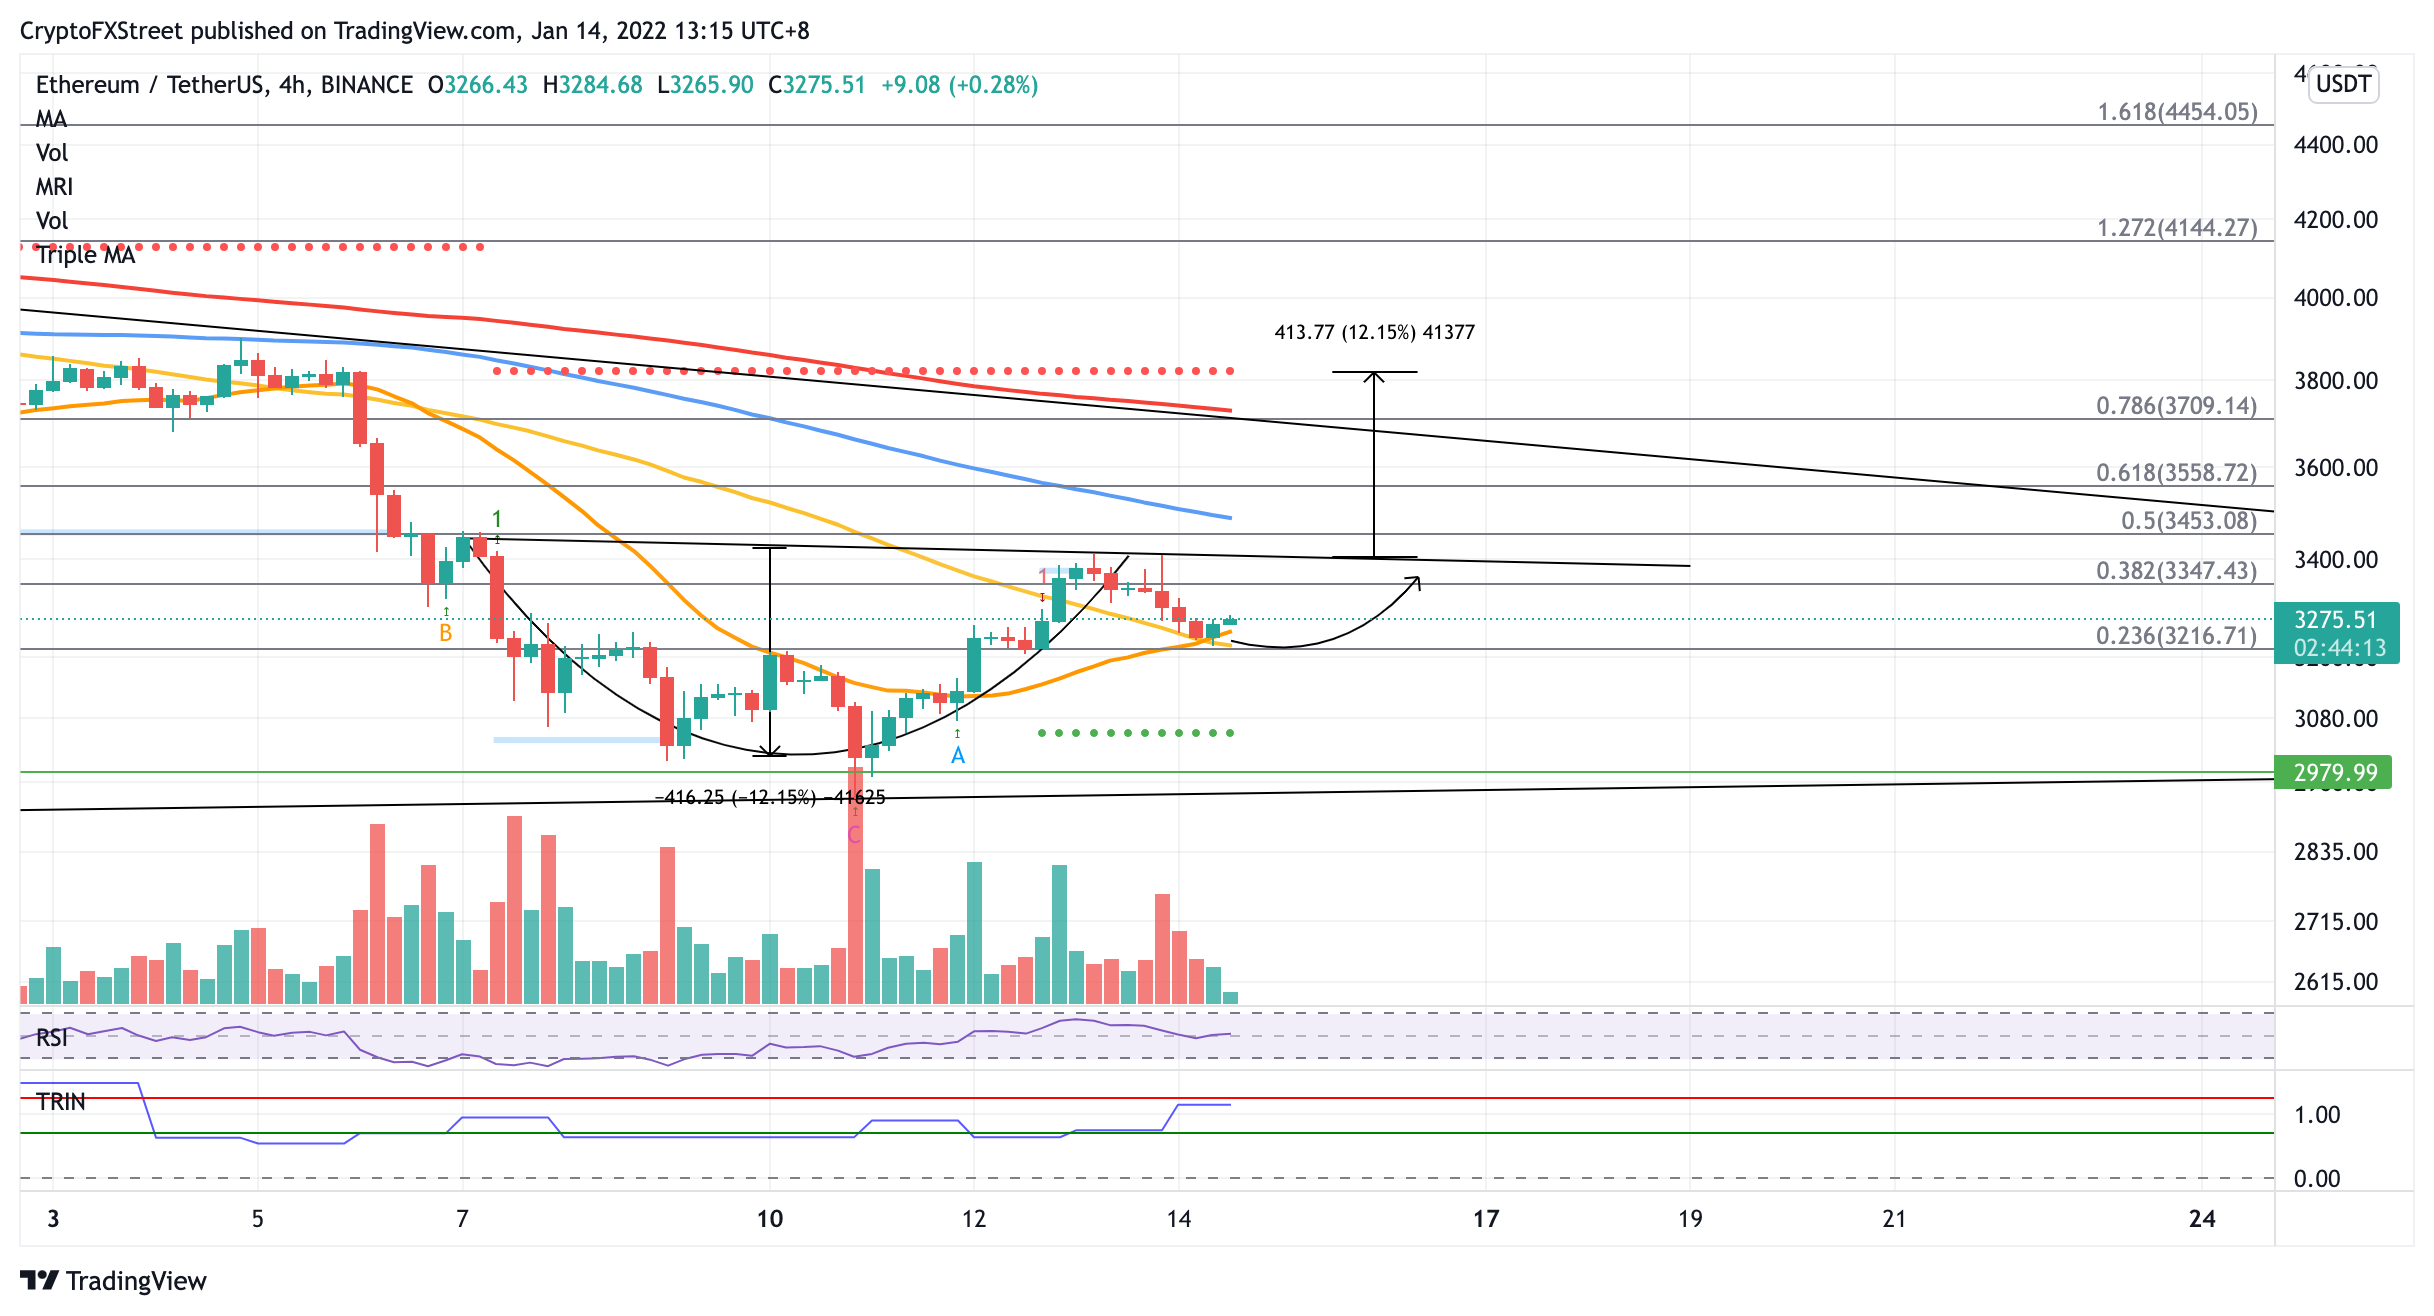
ETH/USDT 4-hour chart
Only a slice above the aforementioned obstacle would offer Ethereum price an opportunity to reach $3,820, intersecting with the resistance line given by the Momentum Reversal Indicator (MRI).
However, if selling pressure increases, Ethereum price will discover immediate support at the 21 four-hour SMA at $3,245, then at the 50 four-hour SMA at $3,216, coinciding with the 23.6% Fibonacci retracement level.
An additional spike in sell orders may push Ethereum price lower toward the January 11 low at $2,979.
Author

Sarah Tran
Independent Analyst
Sarah has closely followed the growth of blockchain technology and its adoption since 2016.


