|

Ethereum Price Analysis: ETH's rising wedge teases short-term pullback

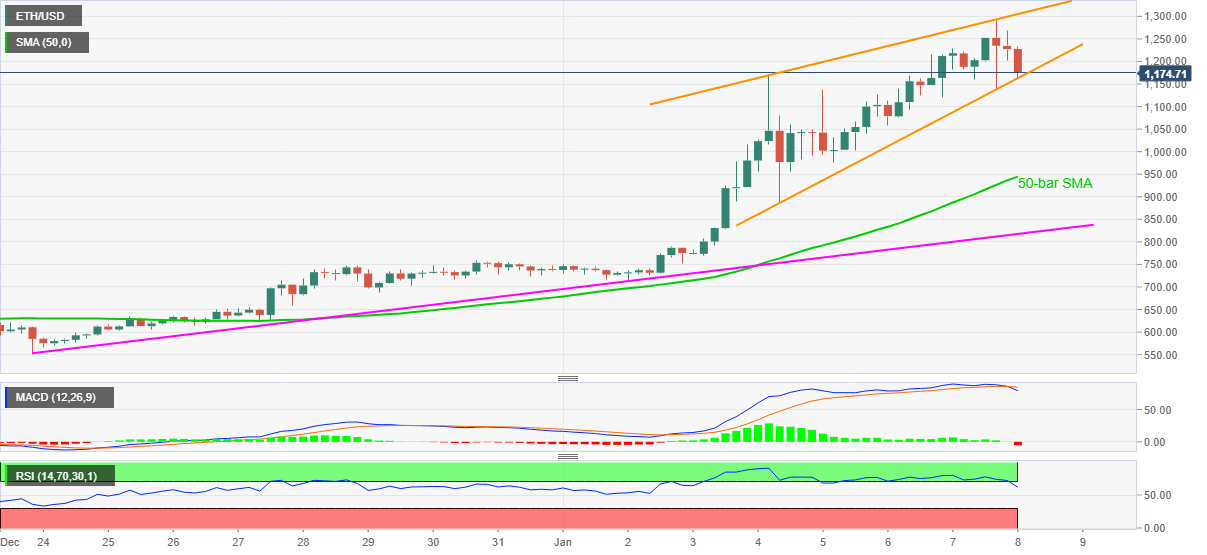
  • ETH/USD bounces off intraday low after stepping back from 2018 top the previous day.
  • Short-term bearish chart pattern, MACD signals probe bulls.
  • 50-bar SMA, two-week-old support line can entertain the bears.

ETH/USD portrays a bearish chart pattern, rising wedge, following its pullback from the highest since January 2018. The quote recently bounces off an intraday low of $1,160 but remains pressured with over 3.0% losses since the start.

Other than the bearish formation, MACD also favors the short-term sellers. However, a clear downside break of $1,300 becomes necessary for the ETH/USD bear’s entry.

Following that 50-bar SMA and an upward sloping trend line from December 23, respectively around $940 and $820 can return to the charts during the Ethereum fall targeting the previous month’s low near $530.

Alternatively, $1,2.50 and the recent high near $1,300 can test intraday buyers before probing them by the resistance line of the stated rising wedge, at $1,310 now.

In a case where the ETH/USD bulls dominate past-$1,310, the year 2018 peak surrounding $1,420 will be on their radars.

To sum up, the Ethereum bulls are catching a breather and the quote can witness further consolidation of the recent gains if the short-term bearish chart pattern gets confirmed.

ETH/USD four-hour chart
Trend: Pullback expected

Additional important levels

Overview
Today last price1185.76
Today Daily Change-41.58
Today Daily Change %-3.39%
Today daily open1227.34
 
Trends
Daily SMA20785.56
Daily SMA50660.5
Daily SMA100530.13
Daily SMA200431.45
 
Levels
Previous Daily High1291.94
Previous Daily Low1140
Previous Weekly High759
Previous Weekly Low625.01
Previous Monthly High759
Previous Monthly Low530.32
Daily Fibonacci 38.2%1233.9
Daily Fibonacci 61.8%1198.04
Daily Pivot Point S11147.58
Daily Pivot Point S21067.82
Daily Pivot Point S3995.64
Daily Pivot Point R11299.52
Daily Pivot Point R21371.7
Daily Pivot Point R31451.46

Author

Anil Panchal

Anil Panchal

FXStreet

Anil Panchal has nearly 15 years of experience in tracking financial markets. With a keen interest in macroeconomics, Anil aptly tracks global news/updates and stays well-informed about the global financial moves and their implications.


More from Anil Panchal
Share:

Editor's Picks

XRP consolidates as inflows and volume climb
Ripple (XRP) retains a slightly bullish outlook on Wednesday despite logging a minor correction from the supply range near $1.15. The remittance token is down 0.5% on the day, reflecting a broader cryptocurrency market drawdown, primarily driven by persistent geopolitical tensions between the United States (US) and Iran in the Middle East.
Bitcoin Price Prediction: BTC recovery holds as ETF inflows persist
Bitcoin (BTC) trades slightly lower around $66,000 on Wednesday as tensions in the Middle East escalate further. Still, the Crypto King is up over 2.5% so far this week.
South Korea crypto volumes shrink as retail investors shift to stocks
South Korea’s major crypto exchanges have seen their trading activity fall sharply over the past year as the country’s stock market surged, suggesting retail speculative interest may be shifting toward equities, Cointelegraph analysis shows.
Hyperliquid, Robinhood could lead crypto’s next bull market as DeFi and TradFi converge

The next crypto bull market could be driven by the growing convergence between blockchain-based financial infrastructure and traditional finance, according to Bitwise CIO Matt Hougan. In a report published late Tuesday, Hougan argued that crypto may be showing early signs of a market bottom, with Bitcoin gaining 9% since July 1 even as the NASDAQ 100 declined 6%.

Bitcoin’s potential recovery in the second half hinges on these 4 catalysts
Bitcoin (BTC) has fallen over 34% in the first half of this year as the King Crypto failed to capitalize on a good semester for risk assets despite the woes from the Iran war.