Ethereum net exchange deposits hits five-month peak with almost 130,000 ETH flowing to exchanges
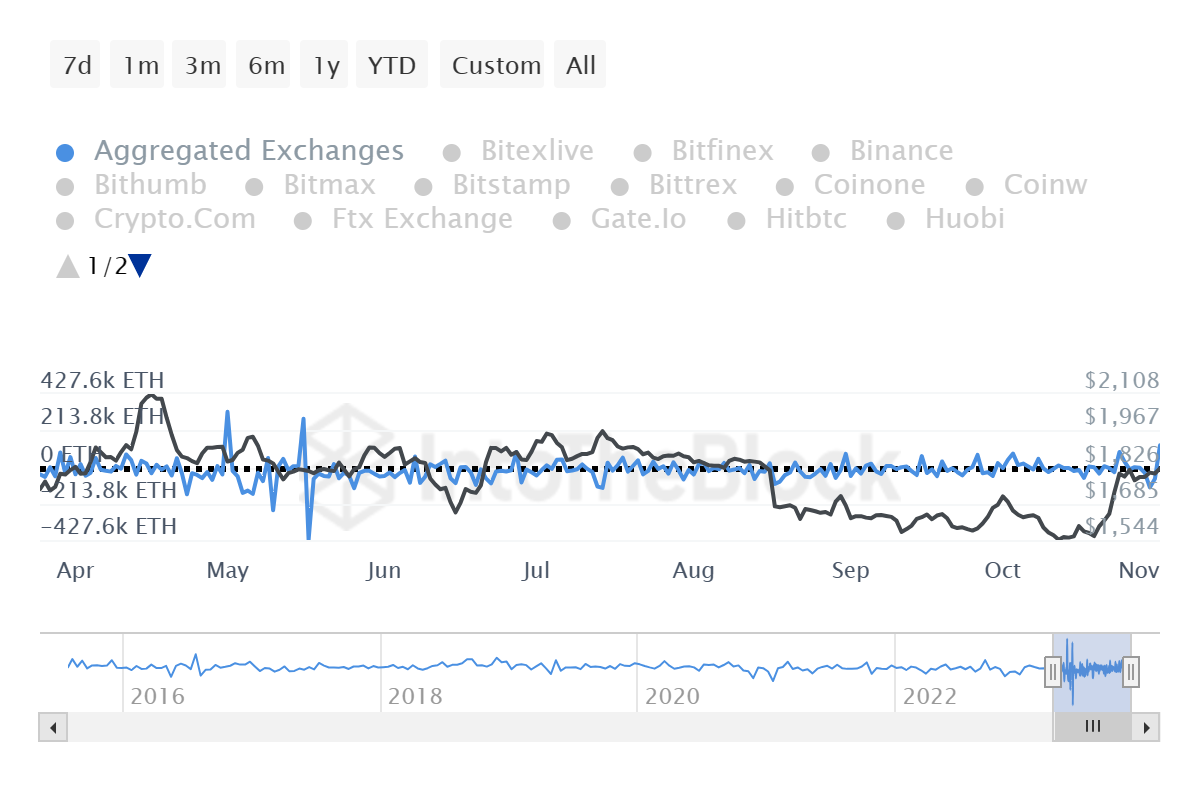
- Ethereum net exchange deposits have hit a five-month peak, recording up to 127,183 ETH flowing into exchanges.
- A positive reading on the Netflows reading is bullish for the altcoin, suggesting traders are buying more than they are selling.
- The last time ETH recorded a higher number was in May at 323,260.
- Steered by the broader market rally, the second-largest crypto by market capitalization could finally make its way to $2,000.

Ethereum (ETH) price was in a consolidation phase for around two months, trapped between $1,748 and $1,591 as its correlation to Bitcoin (BTC) price drew towards the negative. Optimism, or a lack thereof, for exchange-traded funds (ETF) for either assets was the main factor that inspired the wedge as institution players such as Ark Invest pushed to see which product the US Securities Exchange Commission (SEC) would approve first.
Ethereum netflows hit a five-month peak
Ethereum (ETH) Netflows have hit a five-month peak, with up to 127,183 ETH flowing into exchanges. This is worth approximately $233,380,805 at current rates. The metric shows the difference between tokens entering an exchange minus those leaving exchanges, or rather, the net increase or decrease in exchange’s holdings over time.
The number can either be negative or positive, depending on its position relative to the mean. When it is positive, it is bullish, showing traders are buying more than they are selling. On the other hand, a negative reading on the Netflows metric shows there is more selling than buying, thus favoring the downside.
ETH Netflows
Ethereum FAQs
What is Ethereum?
Ethereum is a decentralized open-source blockchain with smart contracts functionality. Serving as the basal network for the Ether (ETH) cryptocurrency, it is the second largest crypto and largest altcoin by market capitalization. The Ethereum network is tailored for scalability, programmability, security, and decentralization, attributes that make it popular among developers.
What blockchain technology does Ethereum use?
Ethereum uses decentralized blockchain technology, where developers can build and deploy applications that are independent of the central authority. To make this easier, the network has a programming language in place, which helps users create self-executing smart contracts. A smart contract is basically a code that can be verified and allows inter-user transactions.
What is staking?
Staking is a process where investors grow their portfolios by locking their assets for a specified duration instead of selling them. It is used by most blockchains, especially the ones that employ Proof-of-Stake (PoS) mechanism, with users earning rewards as an incentive for committing their tokens. For most long-term cryptocurrency holders, staking is a strategy to make passive income from your assets, putting them to work in exchange for reward generation.
Why did Ethereum shift from Proof-of-Work to Proof-of-Stake?
Ethereum transitioned from a Proof-of-Work (PoW) to a Proof-of-Stake (PoS) mechanism in an event christened “The Merge.” The transformation came as the network wanted to achieve more security, cut down on energy consumption by 99.95%, and execute new scaling solutions with a possible threshold of 100,000 transactions per second. With PoS, there are less entry barriers for miners considering the reduced energy demands.
Ethereum price outlook with positive netflows for ETH on exchanges
Ethereum (ETH) price is trading with a bullish bias after a 20% climb beginning in mid-October, before a rejection from the supply zone extending from $1,861 to $2,004. Noteworthy, a supply zone is an area on the chart where the price is likely to reverse due to strong opposing force. It represents an area where there is a significant concentration of selling pressure.
Countered by selling pressure from this supply barrier, Ethereum price corrected around 3% to the current price of $1,798. Nevertheless, momentum remains strong, with the Relative Strength Index (RSI) still above 50 and the Awesome Oscillator (AO) comfortable in the positive zone with green histogram bars.
This outlook, coupled with the fact that the broader market is in a bullish wave, suggests the uptrend for Ethereum price is still plausible. To confirm a solid move north, however, the largest altcoin by market capitalization must record a daily candlestick close above the midline of the supply zone at $1,935. A break and close above this level could set the tone for ETH to stretch to the $2,000 psychological level.
In a highly bullish case, the gains could extend for Ethereum price to flip the supply zone into a bullish barrier, tagging the $2,029 range high, 13% above current value, and levels last tested on April 19.
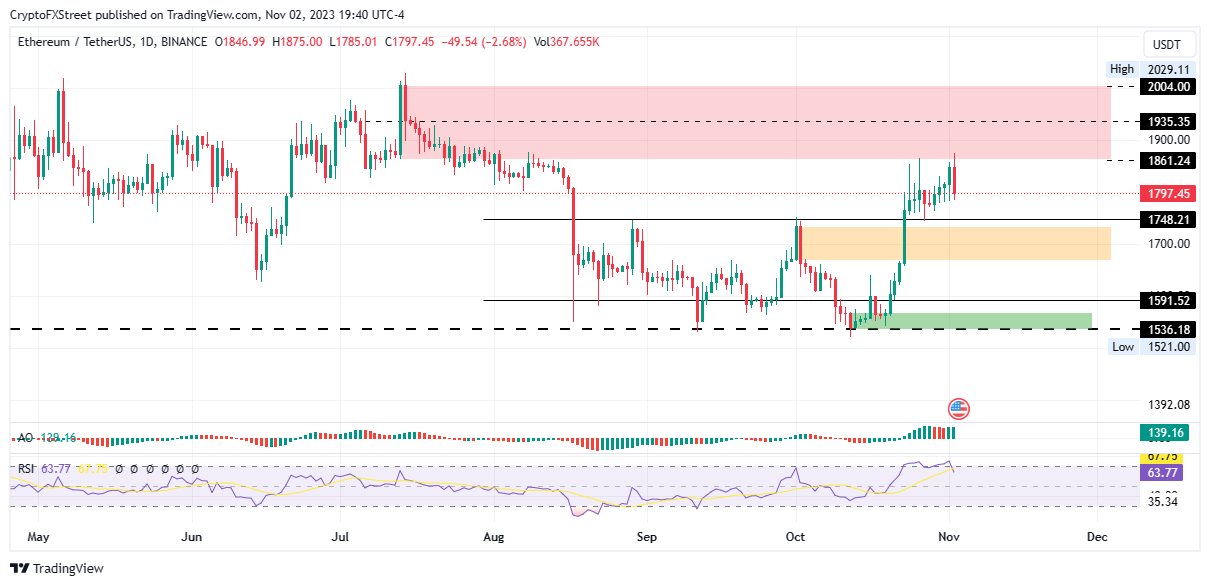
ETH/USDT 1-day chart
Ethereum on-chain metrics support bullish outlook
Behavior analytics platform Santiment supports the bullish outlook for Ethereum price, with the Market Value to Realized Value (MVRV) showing that Ethereum price is still not in the danger zone where a correction would be imminent. This means there is still more room to the upside.
The supply of Tether (USDT) stablecoin is also showing a significant ascent, indicating capital inflow as investors look to buy ETH. Further, the number of whale transactions moving more than 100,000 USD worth of Ether is increasing, with the surge pointing to significant engagement for Ethereum among major players and influential investors.
 [03.05.32, 03 Nov, 2023]-638345682479777516.png)
ETH Santiment
On the flip side, increased selling pressure, and therefore rejection from the supply zone could send Ethereum price further south to lose the $1,748 support, and potentially dip to the zone extending from $1,666 to $1,733. A break and close below its midline at the $1,700 psychological level would confirm a continuation of the downtrend, with ETH likely to test the $1,591 support flow, or worse, extend to the $1,536 swing low.
Author

Lockridge Okoth
FXStreet
Lockridge is a believer in the transformative power of crypto and the blockchain industry.


