Ethereum declines amid ETH ETF outflows and potential whale dump
- Ethereum ETFs recorded $77.3 million in net outflows on Wednesday.
- Wallet related to Elwood Technologies has moved 19,500 ETH to Binance within the past two days.
- Ethereum could bounce off key support level to set new yearly high.

Ethereum (ETH) is down 6% on Thursday following huge exchange deposits by Elwood Technologies and net outflows across ETH ETFs.
Daily digest market movers: Fed rates, Negative flows, ETH exchange deposit
Following the Federal Reserve's decision to keep rates steady at 5.25%- 5.50%, the crypto market has entered a downturn, with Ethereum taking a 6% hit. This also affected the flows seen in Ethereum ETFs.
The combined flows for the nine Ethereum ETFs were negative at -$77.3 million on July 31 as the new Eight failed to soak up $133 million in outflows from Grayscale Ethereum Trust (ETHE).
While ETH ETFs haven't been able to affect ETH's price, Katalin Tischhauser, Head of Investment Research at Sygnum Bank, predicted that they could rake in $5 billion to $10 billion in an interview with Cointelegraph.
She predicted that ETH could rally if/when inflows "turn positive and accelerate" as the market is yet to price in the impact of potential high inflows in ETH ETFs.
Tischhauser noted that ETH could rise to $6,000 if its inflow follows a similar pattern to spot Bitcoin ETFs.
Meanwhile, three wallets related to Elwood Technologies have transferred 19,500 ETH worth $63.66 million to Binance in the past two days, according to data from Lookonchain. This marks the second consecutive time that the wallets' exchange deposits coincided with a crash in ETH's price.
ETH technical analysis: Ethereum could bounce off key support
Ethereum is trading around $3,110 on Thursday, down more than 6% on the day. The price drop triggered over $77.96 million in liquidations, with long and short liquidations accounting for 94% and 6%, respectively.
ETH Long/Short Ratio has declined to 0.92, indicating that most traders expect further price decreases. The support ranging from $2,852 to $2,803 will prove crucial if ETH's price plunges further. ETH has tested this level several times in the past four months, but buyers have always entered the market to prevent a further decline. As a result, a price rise has often accompanied a move to this level.
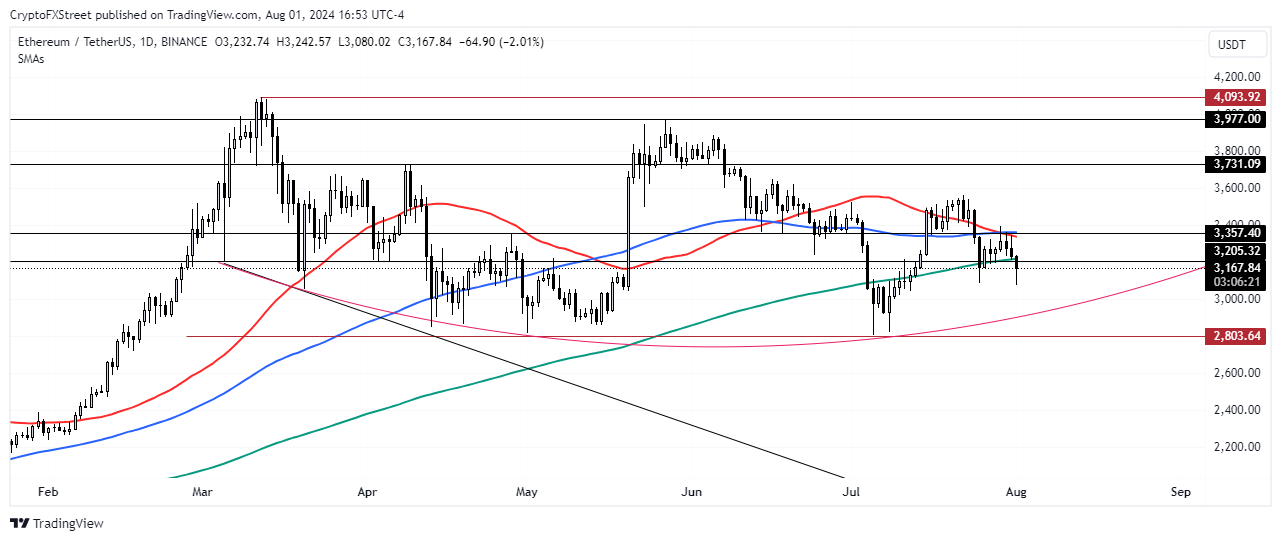
ETH/USDT Daily chart
Also, most traders are bullish in the long term due to the potential effect of spot ETH ETFs when Grayscale outflows diminish.
Hence, ETH could rise over 30% in the coming weeks to test the $4,093 resistance. A move below $2,800 will invalidate the bullish thesis.
Cryptocurrency metrics FAQs
The developer or creator of each cryptocurrency decides on the total number of tokens that can be minted or issued. Only a certain number of these assets can be minted by mining, staking or other mechanisms. This is defined by the algorithm of the underlying blockchain technology. Since its inception, a total of 19,445,656 BTCs have been mined, which is the circulating supply of Bitcoin. On the other hand, circulating supply can also be decreased via actions such as burning tokens, or mistakenly sending assets to addresses of other incompatible blockchains.
Market capitalization is the result of multiplying the circulating supply of a certain asset by the asset’s current market value. For Bitcoin, the market capitalization at the beginning of August 2023 is above $570 billion, which is the result of the more than 19 million BTC in circulation multiplied by the Bitcoin price around $29,600.
Trading volume refers to the total number of tokens for a specific asset that has been transacted or exchanged between buyers and sellers within set trading hours, for example, 24 hours. It is used to gauge market sentiment, this metric combines all volumes on centralized exchanges and decentralized exchanges. Increasing trading volume often denotes the demand for a certain asset as more people are buying and selling the cryptocurrency.
Funding rates are a concept designed to encourage traders to take positions and ensure perpetual contract prices match spot markets. It defines a mechanism by exchanges to ensure that future prices and index prices periodic payments regularly converge. When the funding rate is positive, the price of the perpetual contract is higher than the mark price. This means traders who are bullish and have opened long positions pay traders who are in short positions. On the other hand, a negative funding rate means perpetual prices are below the mark price, and hence traders with short positions pay traders who have opened long positions.
Author

Michael Ebiekutan
FXStreet
With a deep passion for web3 technology, he's collaborated with industry-leading brands like Mara, ITAK, and FXStreet in delivering groundbreaking reports on web3's transformative potential across diverse sectors. In addition to


