|

Ethereum Classic vs Ethereum technical analysis

  • ETC/ETH is up 1.5% on the session and the price has stalled ahead of the 0.0400 psychological level.
  • There is a key resistance level and trendline halting moves higher at the moment.
  • On the daily candlestick chart there has been two rejections of higher levels.
Ethereum classic chart

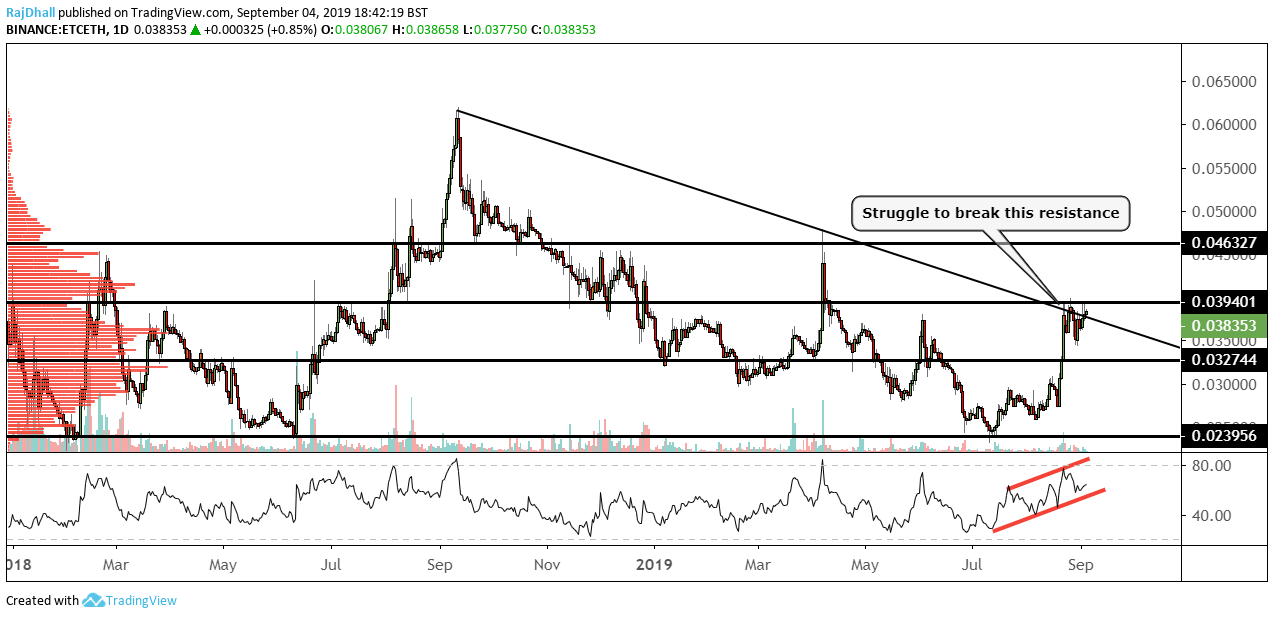
ETC/ETH looks to have stalled on the daily chart above. There was a key trendline that price broke indicating more upside movement but since the move has not really materialized.

The 0.03940 level looked like a pretty strong resistance level in any case but after the momentum seen yesterday, you would be forgiven if you thought it would have continued. 

Now on the downside, there are two scenarios in focus. One is the retest of the trendline at a lower level and a move back up. The second would be a move lower to test the 0.03274 support level.

Looking at the RSI now there is a pattern that looks vulnerable to a downside break. This could suggest we are in need of a retracement as the momentum indicator is showing signs of a slowdown. 

0.0400 has not been tested either yet and maybe that is the reason for the price stalling at these areas. 

Lastly, today the price is 1.5% higher so let's see what happens for the rest of the session and also wait for the Asian traders to step in. 

Author

Rajan Dhall, MSTA

Rajan Dhall is an experienced market analyst, who has been trading professionally since 2007 managing various funds producing exceptional returns.

More from Rajan Dhall, MSTA
Share:

Editor's Picks

Ripple risks extending drop as June lows come into view

Ripple (XRP) ticks down below $1.20 with short-term support at $1.16 intact at the time of writing on Thursday. An early-week rally was rejected at $1.28, weighing on sentiment as traders broadly de-risked.

Crypto Today: Bitcoin, Ethereum and XRP pare losses on increasing bets of Fed tighter monetary policy

Cryptocurrency prices are broadly moderating downwards on Thursday, as market participants assess the impact of the Fed’s hawkish monetary policy stance. Bitcoin edges lower, with support at $64,000 holding.

Bittensor Price Forecast: TAO closes in key support, risking deeper losses

Bittensor price edges below $250 at press time on Thursday, marking its fourth straight day of losses. The AI token is losing retail demand as TAO futures Open Interest dips over 8% in the last 24 hours.

Bitcoin slips below $64,000 as hawkish Fed stance weighs on risk appetite

Bitcoin remains under pressure, extending its correction, trading below $64,000 at the time of writing on Thursday. The US Fed left interest rates unchanged but struck a hawkish tone on Wednesday, dampening the risk sentiment.

Experts agree: Bitcoin nears bottom, but weak demand raises doubts
Bitcoin (BTC) is trading above $63,000 at the time of writing on Friday after rebounding from the key 200-week Simple Moving Average (SMA) near $62,000, a level widely viewed as key long-term support. The recovery may suggest that Bitcoin has found a floor after a sharp correction that spanned more than a month, but some warning signs persist.