Ethereum Classic Price Prediction: ETC slump continues, but watch out for a bullish hammer reversal
- Ethereum Classic price discovers support near 2018 high as selling in the cryptocurrency market accelerates.
- ETC remains locked in a descending channel that began May 25.
- Last above-average volume day was the May 19 crash.

Ethereum Classic price has been in a corrective decline since the May 24 bounce, presenting few actionable trading opportunities for investors. The volatility of the last two days reinforces the need to practice patience with the cryptocurrency. Still, it is important to note that ETC could close today with a bullish hammer candlestick pattern on the daily chart.
Ethereum Classic price takes weakness in stride
From the May 6 high at $158.76 until the May 19 low, Ethereum Classic price erased 75% of ETC value, including a one-day drop of 55% on May 19. The ETC volatility was an extraordinary reversal of fortune for investors. Before the correction, Ethereum Classic price had reported a 1,200% advance over the previous six weeks after releasing from a symmetrical triangle. Despite the fluctuations, ETC closed May with a 90% gain.
A bullish outcome of the historic correction and recent drift lower was removing the extreme overbought readings on the daily and weekly Relative Strength Indexes (RSI). It has positioned Ethereum Classic price to achieve a sustainable rally once the broader market uncertainty subsides.
Ethereum Classic price stabilized today around May’s declining trend line and just above the critical 2018 high at $46.98, a level that played a key role on May 19 and 23. As long as ETC stays above the 2018 high on a daily closing basis, the outlook remains neutral with a bearish tilt.
If ETC fails to hold the above-mentioned level, Ethereum Classic price will discover some support at the 78.6% Fibonacci retracement at $43.03 and then the confluence of the May 19 and 23 lows at $40.00 and $40.20, respectively. A daily close below $40.00 uncovers no meaningful support until the intersection of the 200-day simple moving average (SMA) at $25.16 with the low of April’s cup base at $24.74, a decline that seems remote at this point.
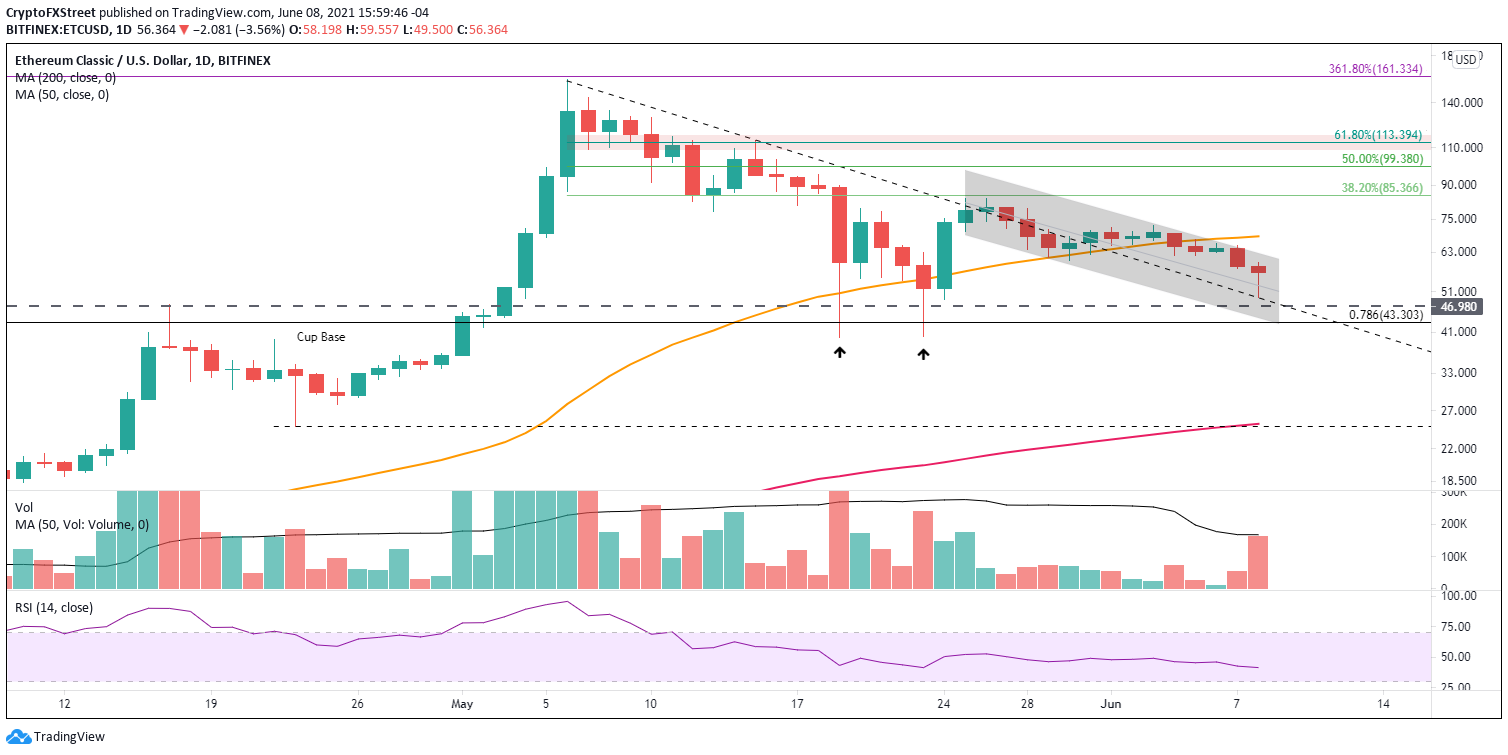
ETC/USD daily chart
At the time of writing, Ethereum Classic price could be on course to close with a bullish hammer candlestick pattern. If the digital asset does close today with a hammer candlestick pattern, investors can use the candlestick’s current high at $59.55 as the trigger price to initiate a new position in ETC. The stop would be the low of the candlestick, offering a solid risk-reward opportunity.
The hammer pattern is best found in a protracted downtrend that is beginning to show increased weakness. Initially, the sellers or the bears attempt to drive the price lower in hammer formation, but buyers emerge, aggressively lifting the price higher, displaying that bulls are now in control.
Author

Sheldon McIntyre, CMT
Independent Analyst
Sheldon has 24 years of investment experience holding various positions in companies based in the United States and Chile. His core competencies include BRIC and G-10 equity markets, swing and position trading and technical analysis.


