Ethereum Classic price signals ETC is on the cusp of a 45% rally
- Ethereum Classic price remains encased in a channel along May’s declining trend line.
- ETC 50-day simple moving average (SMA) holds price drift over the last three days.
- Social volume remains elevated from a longer perspective and on a smoothed basis.

Ethereum Classic price closed last week with an inside week on the bar charts and a 27% gain after collapsing 45% the previous week. The ETC rebound did not introduce an overbought reading on any appropriate timeframe, indicating that the decline since May 26 is not the beginning of a new leg lower. Instead, it is a simple, quiet release of the price compression provoked by the series of sharp declines and rebounds the preceding days, placing the cryptocurrency in a timely position moving forward.
Ethereum Classic price steadies after an explosive month
From the May 6 high at $158.76 until the May 19 low, Ethereum price erased 75% of ETC value, including a drop of 55% at the May 19 low. The ETC volatility was an extraordinary reversal of fortune for investors. Before the correction, Ethereum Classic price had registered a 1,200% advance over the previous six weeks after breaking out from a symmetrical triangle at the beginning of April. Nevertheless, Ethereum Classic price is on pace to close May with an 85% gain.
A bullish outcome of the historic correction was removing the overbought readings on the daily and weekly Relative Strength Indexes (RSI). It positioned Ethereum Classic price to stage a meaningful rebound in a short period.
Ethereum Classic price made a statement on May 24, closing up 42%, the largest daily gain since May 2017. The sharp bounce could not overcome May’s declining trend line on a sustainable basis, and ETC fell into the current decline and within the boundaries of a descending channel.
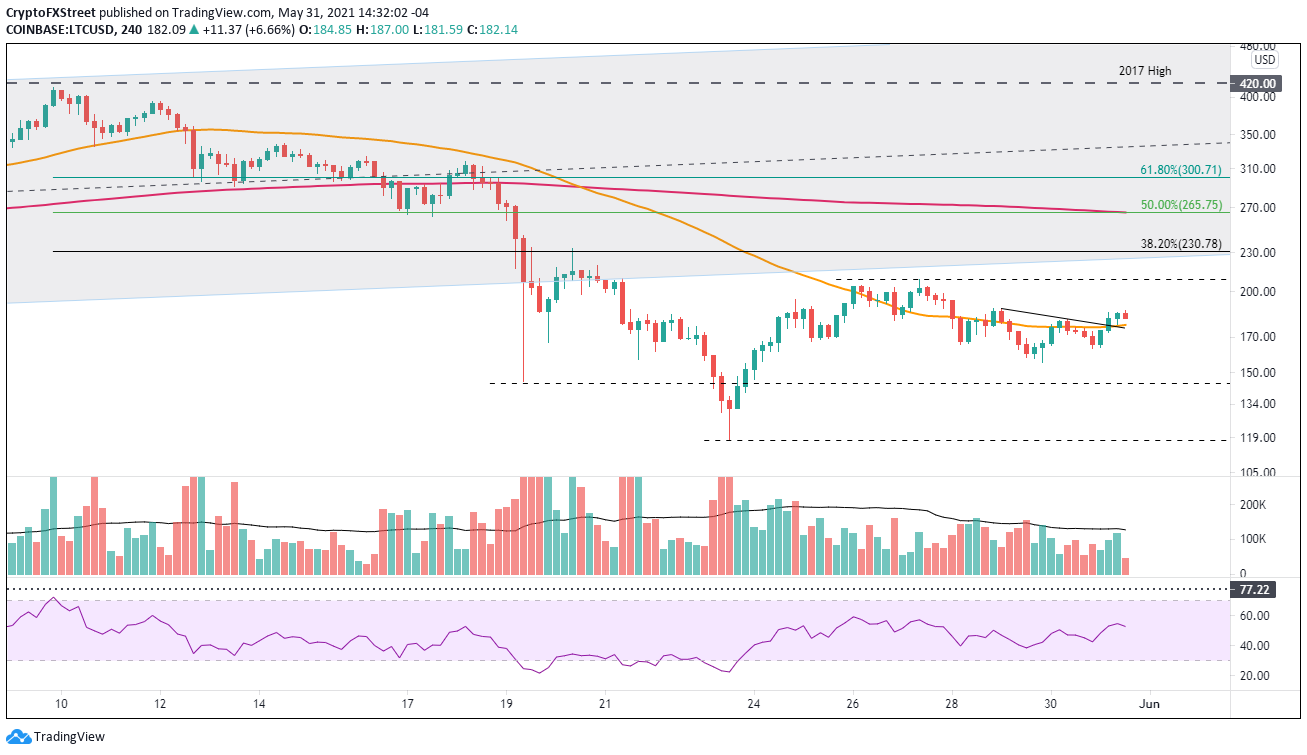
A close above the junction of the 50 four-hour (SMA) at $69.41 and the channel’s upper trend line at $69.65 would spark a renewal of the bounce from the May 23 low, boosting Ethereum Classic price to the 200 four-hour SMA at $78.52. Once the critical moving average is disposed of, ETC will not face significant resistance until the confluence of the May 26 high at $84.08 and the 38.2% Fibonacci retracement of the May correction at $85.36.
If Ethereum Classic price extends the rally, ETC should rise to test the 50% retracement at $99.38 and the psychologically important $100.00, representing a 45% gain for the cheaper Ethereum.
Other resistance points of interest include the 61.8% retracement at $113.94, the all-time high at $158.76 and of course, the 361.8% extension of the 201-2019 correction at $161.33, offering a 140% profit for committed ETC investors.
LTC/USD 4-hour chart
A close below the channel’s lower trend line at $56.70 will sabotage the bullish narrative. Additional selling will not meet support until the 2018 high at $46.98. It would signify that Ethereum Classic price is building a more complex bottom or potentially pursuing a much deeper correction.
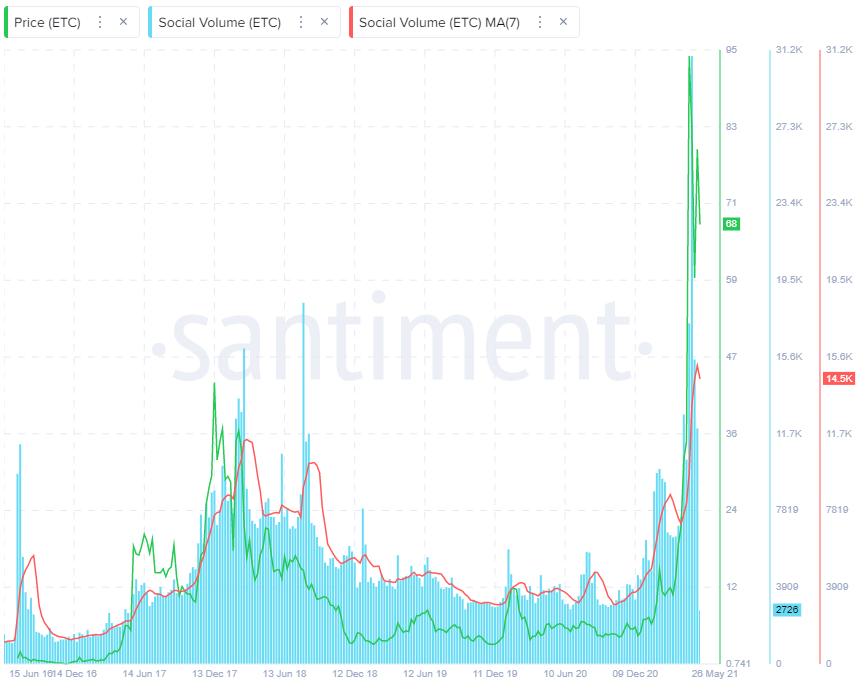
During the correction, there has been a sizeable contraction in social volume on a short-term basis, but from a larger perspective and on a smoothed basis, it remains at the highest level since 2016.
The Santiment social volume metric calculates the number of mentions of the coin on 1000+ crypto social media channels, including Telegram, crypto subreddits, discord groups and private traders chats.
ETC social volume
Ethereum Classic price had an incredible run in April and early May, lifting social media volume to historic highs. However, the sharp correction in May still hasn’t compressed the smoothed social volume metric (red) to past levels. It suggests that April-May’s type of price action that augments social volume will not be duplicated any time soon, so investors should be prepared for incremental rallies with extended periods of sideways price action.
Author

Sheldon McIntyre, CMT
Independent Analyst
Sheldon has 24 years of investment experience holding various positions in companies based in the United States and Chile. His core competencies include BRIC and G-10 equity markets, swing and position trading and technical analysis.