Ethereum Classic Price Prediction: ETC exposed to a 15% slump before resuming rally
- Ethereum Classic price logs fourth consecutive positive week for the first time since April 2020 (another low).
- ETC daily Relative Strength Index (RSI) records the first overbought reading since May, showing the impulsiveness of the rally.
- ETC social media dominance has remained unchanged at 2% since July 21, despite a rally of over 80%.

Ethereum Classic price overlooked the bearish momentum divergence on the intra-day timeframes this weekend. It erupted with an 11.72% gain on Sunday, discarding the resistance of the June 30 high of $62.45 and installing ETC within striking distance of the 38.2% Fibonacci retracement at $80.75. Nevertheless, the cryptocurrency heavyweights, ETH and BTC, are showing bearish momentum divergences that may spill over into the broader cryptocurrency complex, thereby complicating the Ethereum Classic price outlook.
Ethereum Classic price faces short term headwinds
Ethereum Classic price shows a 34.04% gain for August, making it the best August performance since 2016 and unlocking ETC from the magnet effect of the 2018 high at $46.98 that had been support or resistance during May and June. Moreover, the superior returns in August have broke Ethereum Classic price out from the governing declining parallel channel that began in May.
Moving forward, Ethereum Classic price opportunities for newcomers may be limited by the convergence of the two cryptocurrency heavyweights flashing a high probability of a correction with the restrictions of the 38.2% retracement level at $80.75. Specifically, the potential exists for ETC to reverse the weekend gains and test the June 30 high of $62.45 or the July ascending trend line currently around $59.10 in the coming sessions before the altcoin can confidently resume the rally through the layers of Fibonacci levels beginning at $80.75. It would constitute a -15% correction from the current price.
A daily close below the July ascending trend line would be a concerning development and expose Ethereum Classic price to test the 50-day simple moving average (SMA) at $51.90, or the 2018 high of $46.98.
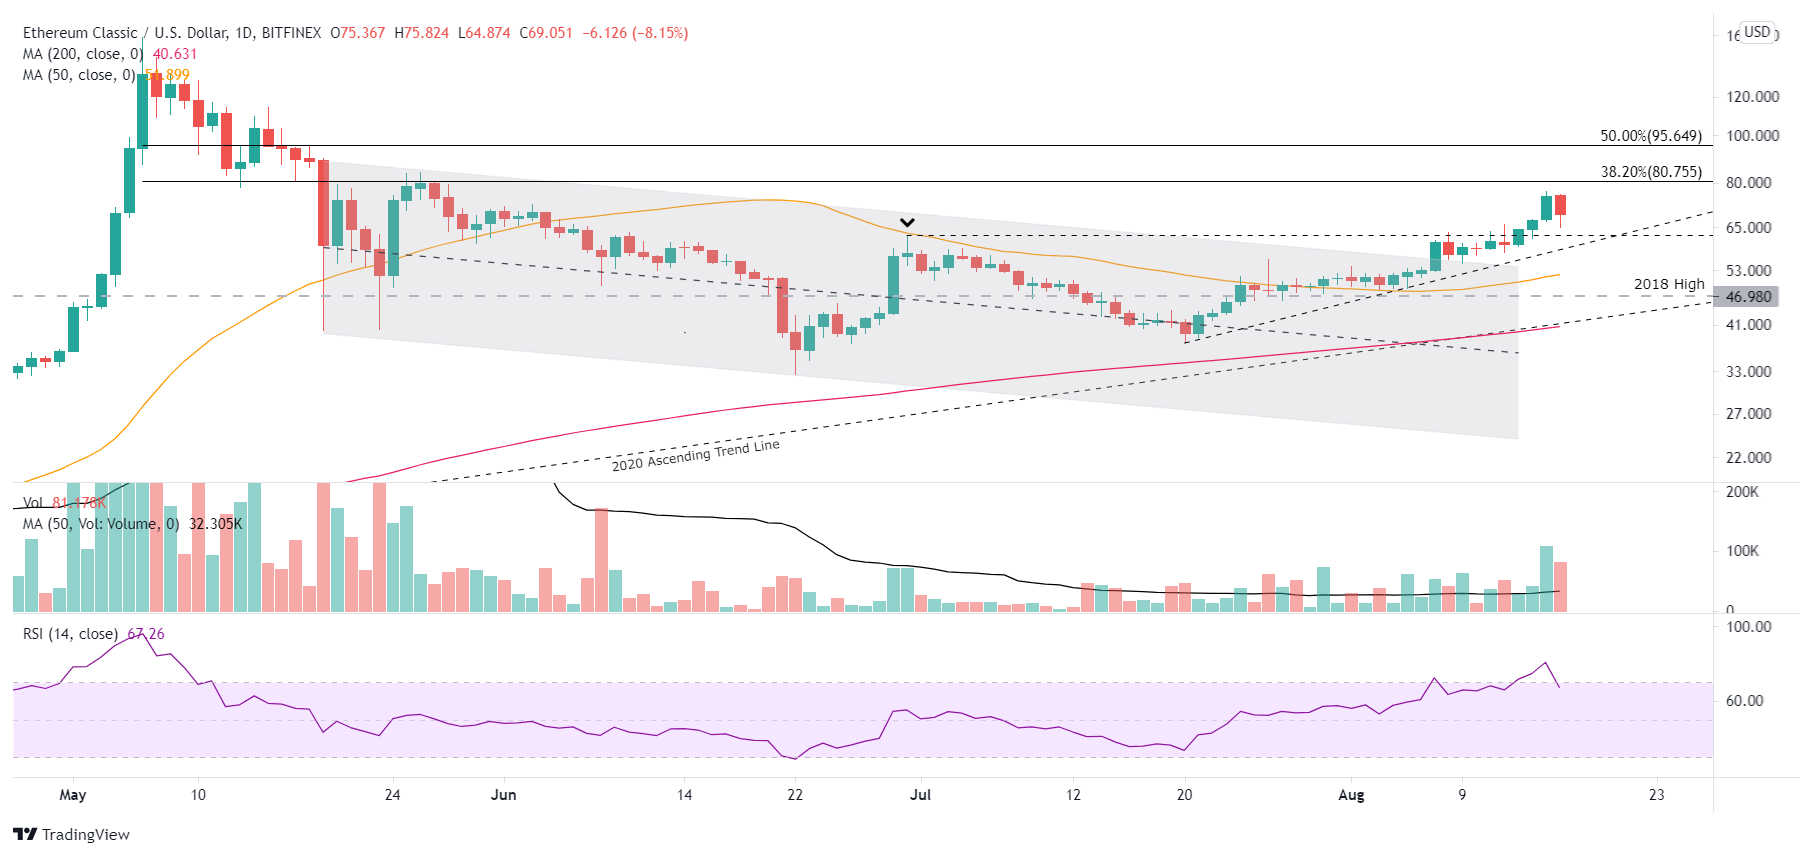
ETC/USD daily chart
Alternatively, a continuation of altcoin outperformance could propel Ethereum Classic price through the 38.2% retracement level at $80.75 to the 50% retracement at $95.64, registering a 40% gain from the current price.
To monitor the Ethereum Classic price posture, keep close attention to the ETC market dominance percentage number. It just broke out above the upper line of a descending triangle pattern, and the 50-day SMA has turned higher, potentially signaling that the altcoin is assuming a leadership role in the cryptocurrency complex.
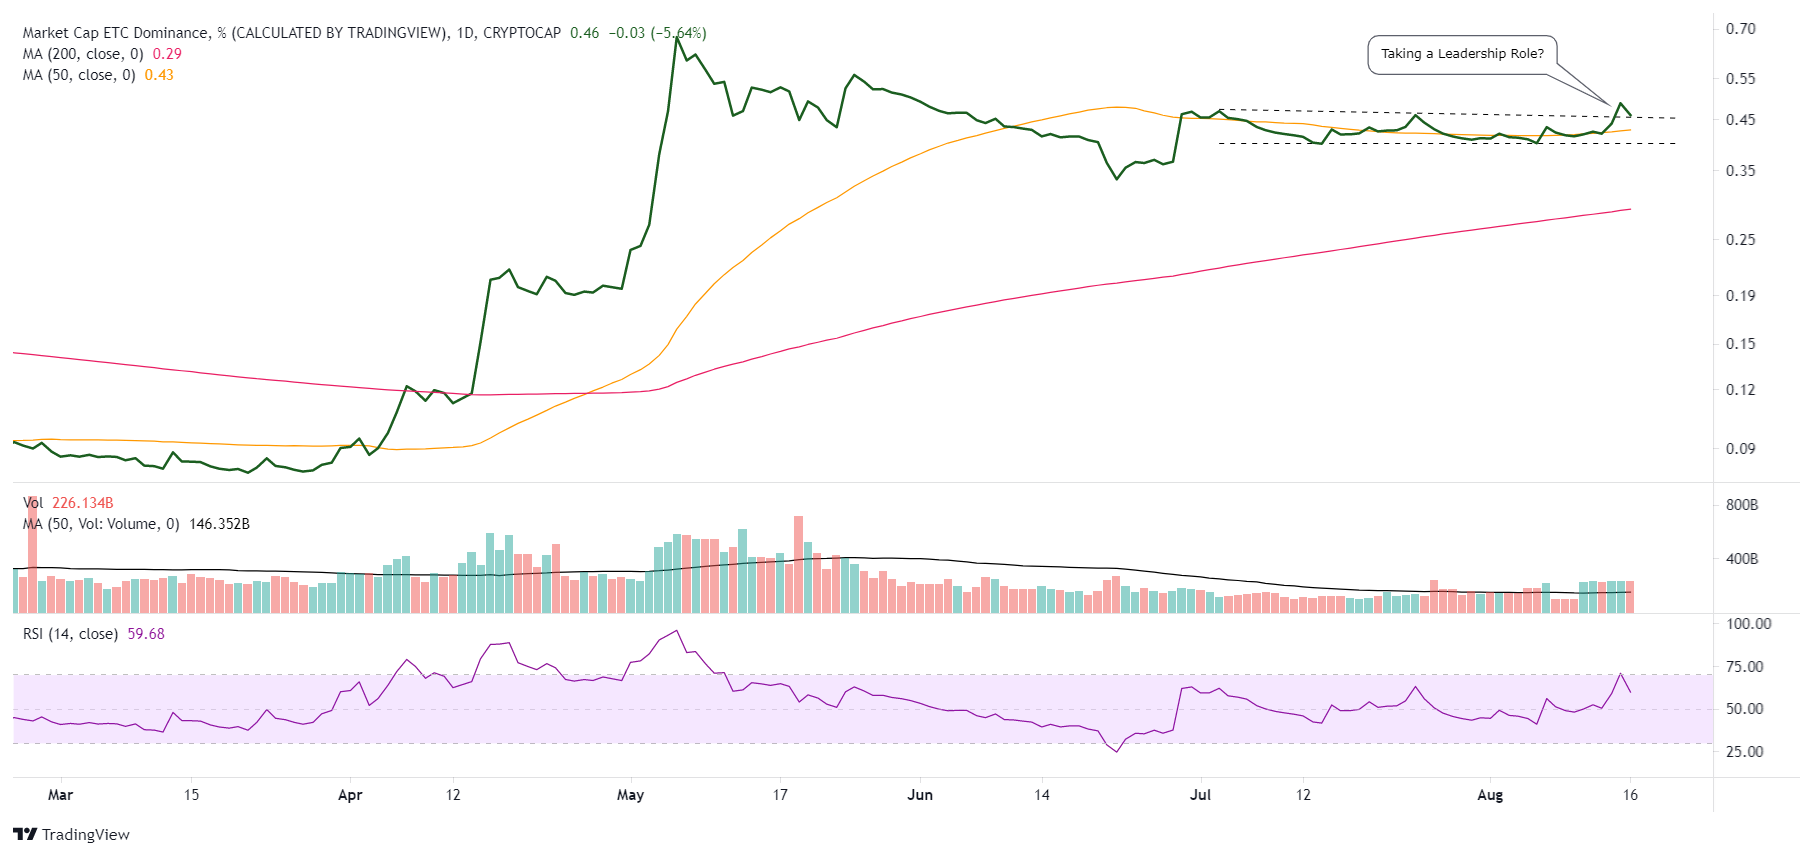
ETC Market Dominance % daily chart
Despite the strong performance from the July lows and emerging signs of Ethereum Classic price pursuing a leadership role in the cryptocurrency complex, the ETC mentions on crypto-related social media, compared to a pool of 50+ of the most talked-about projects online, has remained constant around a 2% share based on the 30 eight-hour moving average.
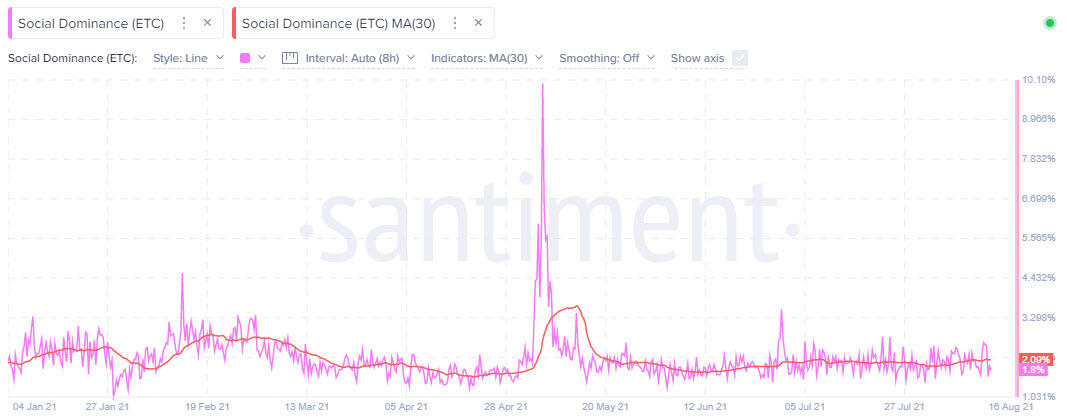
ETC Social Dominance - Santiment
The marginal improvement in social dominance is a consistent feature of most altcoins over the last few weeks, as skepticism still reigns over the market even though gains have been sizeable. Once Ethereum Classic price can confirm a leadership role by capturing at least the 38.2% retracement and possibly the 50% retracement, it may trigger a spike in ETC social dominance that has underpinned the periods of accelerated upside momentum in 2021.
Author

Sheldon McIntyre, CMT
Independent Analyst
Sheldon has 24 years of investment experience holding various positions in companies based in the United States and Chile. His core competencies include BRIC and G-10 equity markets, swing and position trading and technical analysis.


