Ethereum Classic price in an advantageous position, sets ETC up for a test of $80
- Ethereum Classic price emerged from the descending parallel channel and triggered an inside month on August 7 with a 13.77% gain.
- ETC is now comfortably above the imposing 2018 high of $46.98, freeing it to pursue higher prices.
- The altcoin registered an overbought signal on the daily Relative Strength Index (RSI) on August 7, temporarily suffocating the rally.

Ethereum Classic price closed July with an inside month that triggered on August 7 with a 13.77% gain. The price compression generated by the inside month should propel ETC to higher prices over the longer term. In the short term, the cryptocurrency is struggling to build on the breakout from the descending parallel channel and inside month, suggesting that the overbought condition on the daily RSI may be interfering with Ethereum Classic price.
Ethereum Classic price compression leading to an upside expansion
Over the last four months, Ethereum Classic price shows a gain of 62.79% on a closing basis, despite the 80% collapse in May and June. Moreover, ETC closed July with a rare inside month on the bar charts. The inside month symbolizes price compression and the potential for outsized moves once the previous month’s high or low is broken.
Since Ethereum Classic price is now in a new cyclical uptrend and remains in a secular uptrend, the resolution of the inside month to the upside should not come as a surprise and portends higher prices over the longer term.
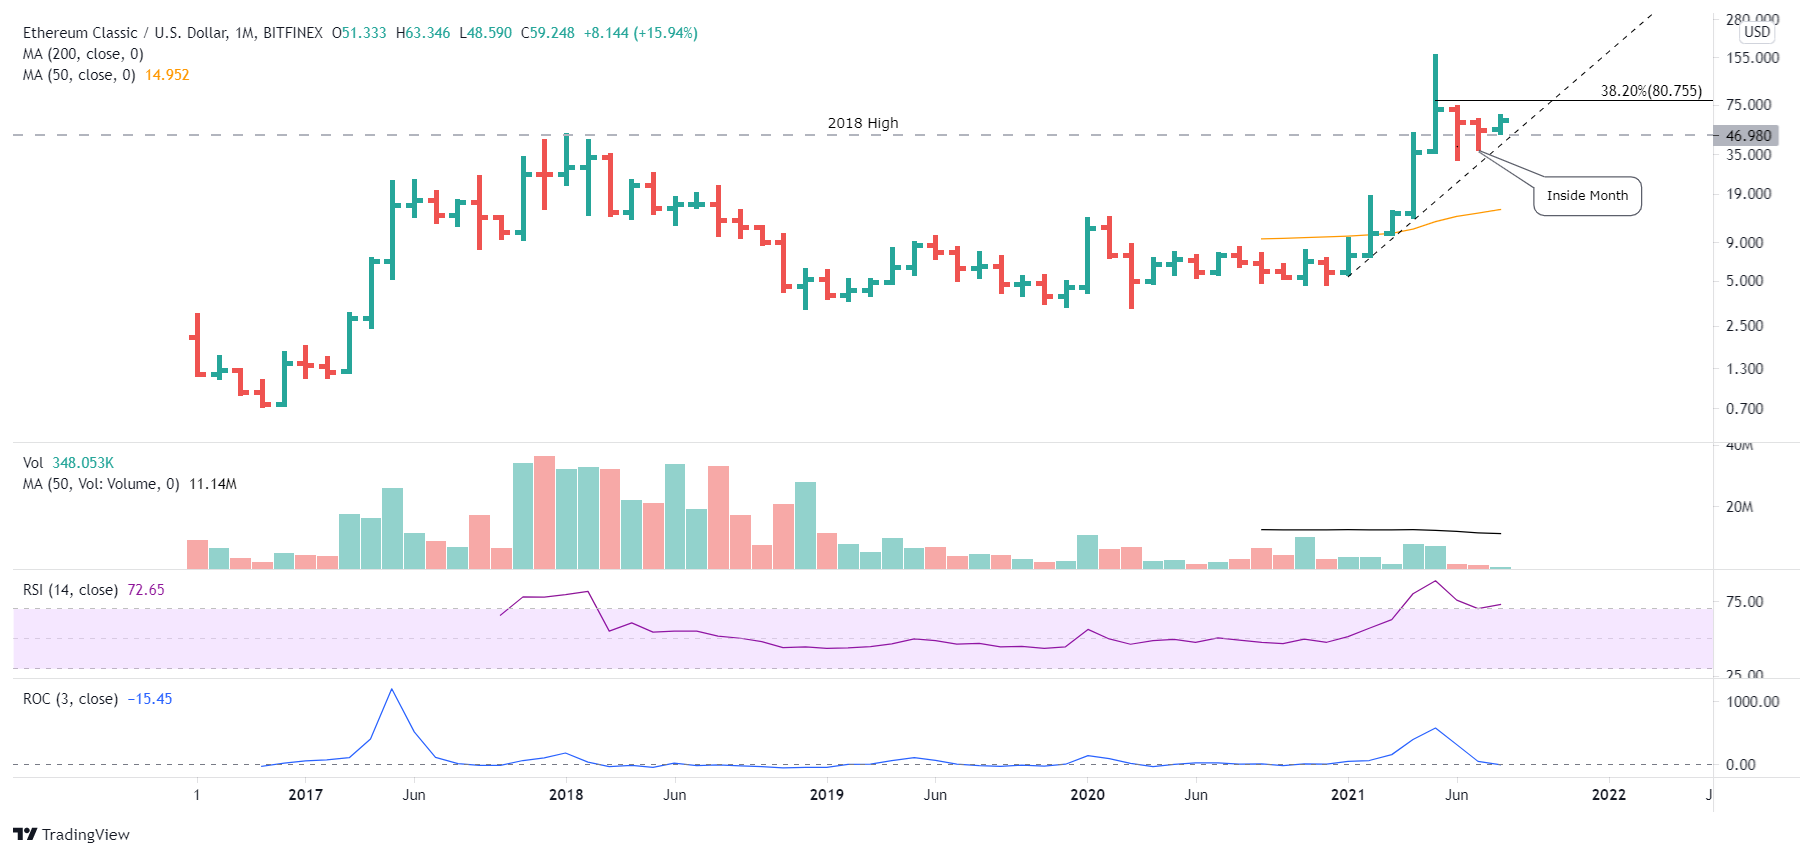
ETC/USD monthly chart
The 13.77% gain on August 7 was the largest since June 29 and resolved the descending parallel channel guiding ETC since the May 19 low.
Over the last three days, Ethereum Classic price has moved sideways, balancing the breakout with the resulting overbought condition on the daily RSI. As long as ETC holds the channel’s upper line, it should be positioned for higher prices, including a test of the 38.2% Fibonacci retracement of the May-June correction at $80.75, marking a 36% gain from the current price.
The May 13 low of $78.25 and the highs from May 25 to May 28 between $79.55 and $84.08 enforce the strength of the retracement level’s resistance.
Fortunately for ETC speculators, the downside risk for Ethereum Classic price should be limited to the union of the 50-day simple moving average (SMA) at $48.82 with the 2018 high of $46.98, or close to 20% from the current price.
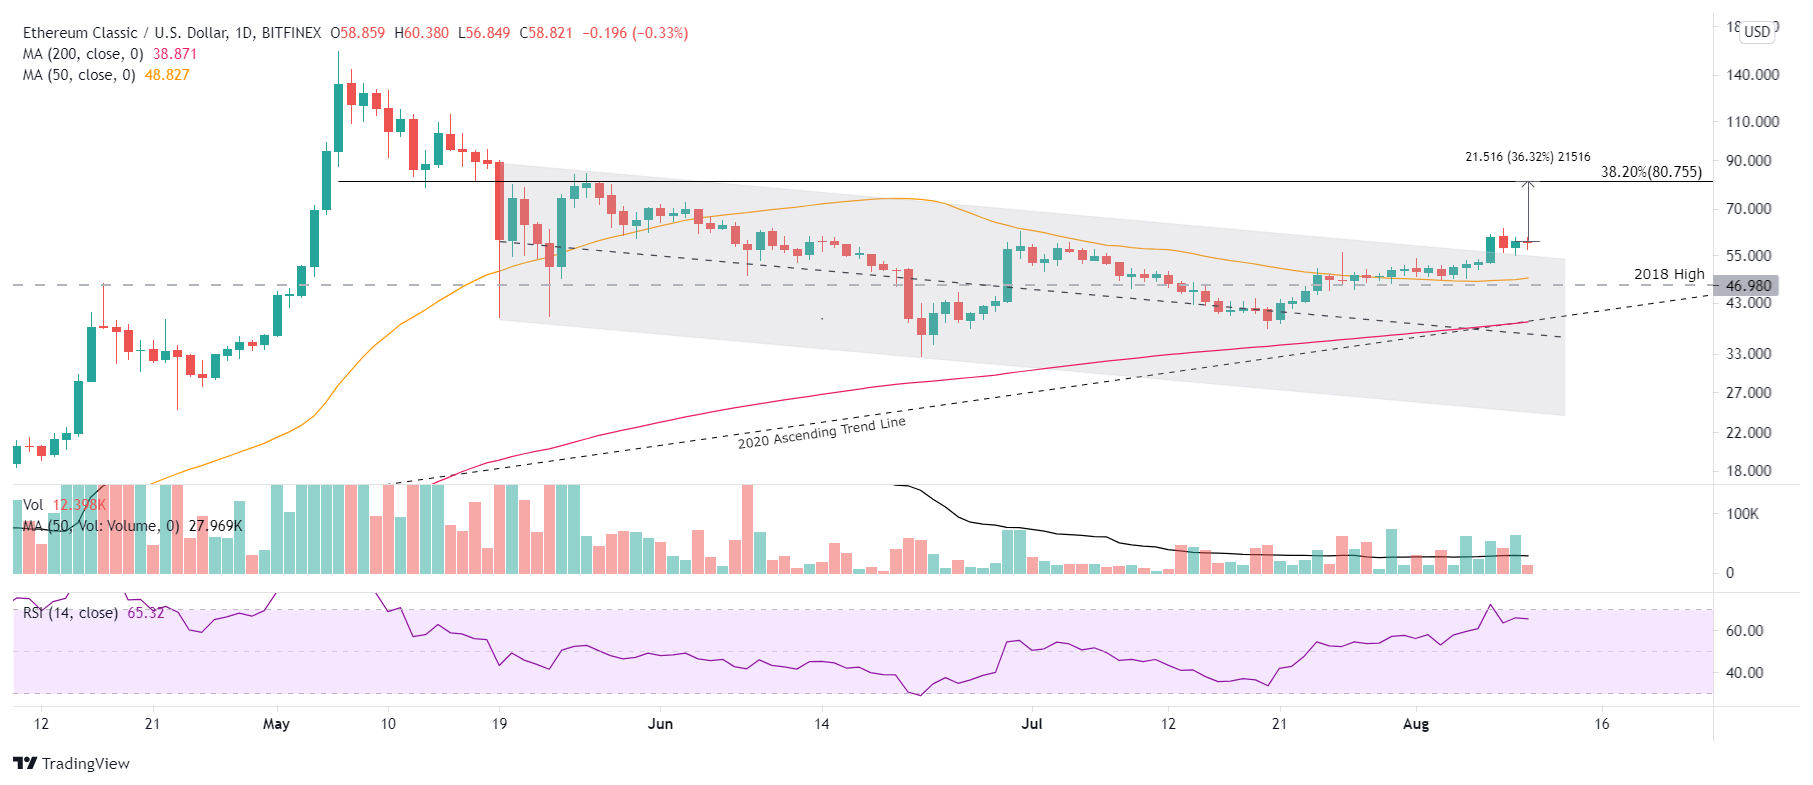
ETC/USD daily chart
The bullish narrative would come under question if Ethereum Classic price closed below the 2018 high. The focus would shift to the convergence of the 2020 ascending trend line with the 200-day SMA at $38.87 and then the July 20 low of $37.75. However, by that time ETC investors should not be trafficking in the altcoin.
Ethereum Classic price began the rally from July 21 in a constructive position versus its price structure compared to several cryptocurrencies. ETC was significantly above the 50-week and 200-day SMAs and was not trapped by resistance defined by the May lows or stifled by a bearish Death Cross pattern. The result was a rally of nearly 60% at yesterday’s high.
Today, Ethereum Classic price remains in an advantageous position and has the technical credentials to foster a continuation of the ETC rally to the 38.2% retracement level at $80.75. It is just a question of how long the consolidation will be due to the mild overbought condition on the daily RSI.
Author

Sheldon McIntyre, CMT
Independent Analyst
Sheldon has 24 years of investment experience holding various positions in companies based in the United States and Chile. His core competencies include BRIC and G-10 equity markets, swing and position trading and technical analysis.


